Leverage the power of VTK by partnering with Kitware
What It's Like to Work with Us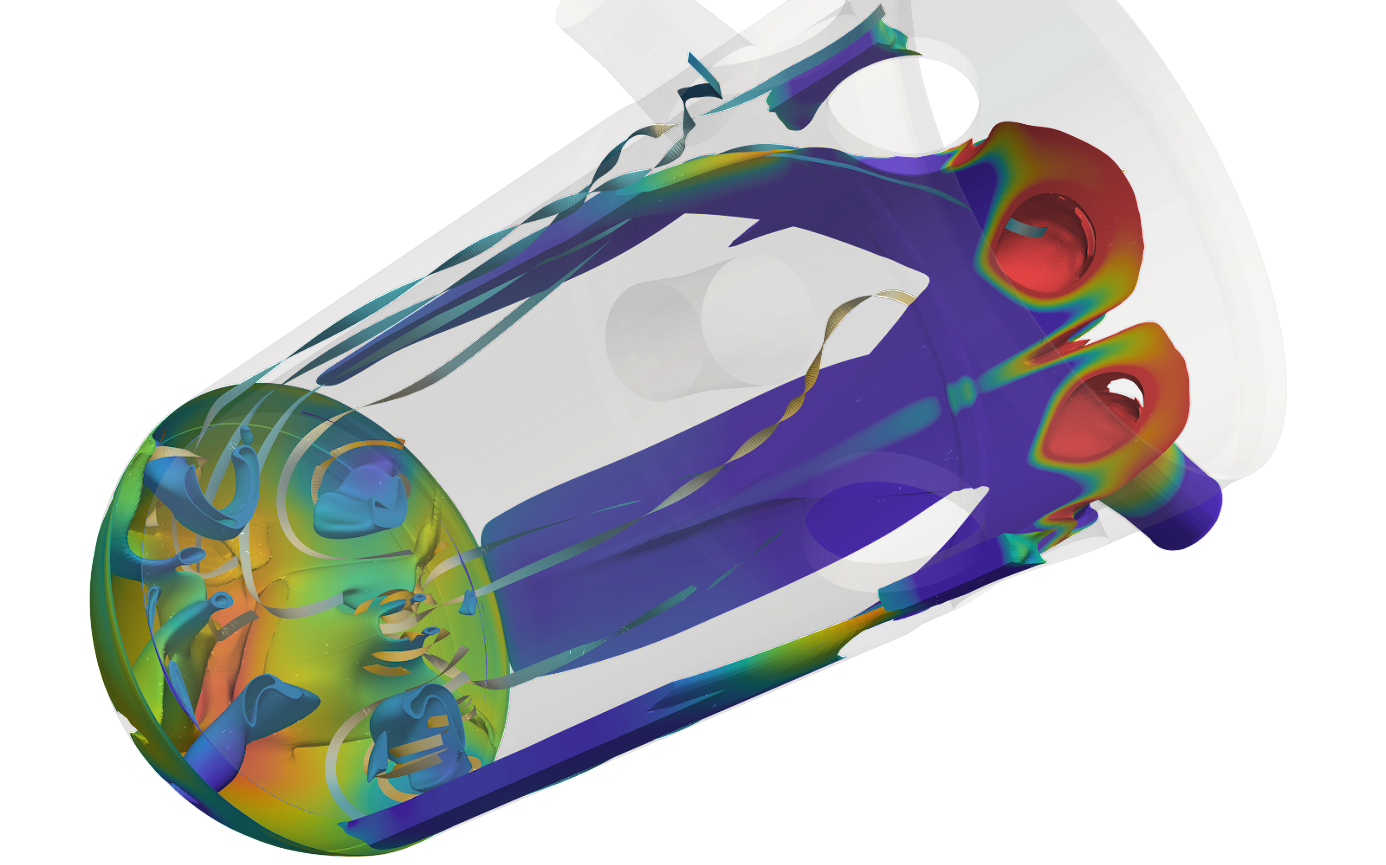
Process images and create 3D computer graphics with the Visualization Toolkit.
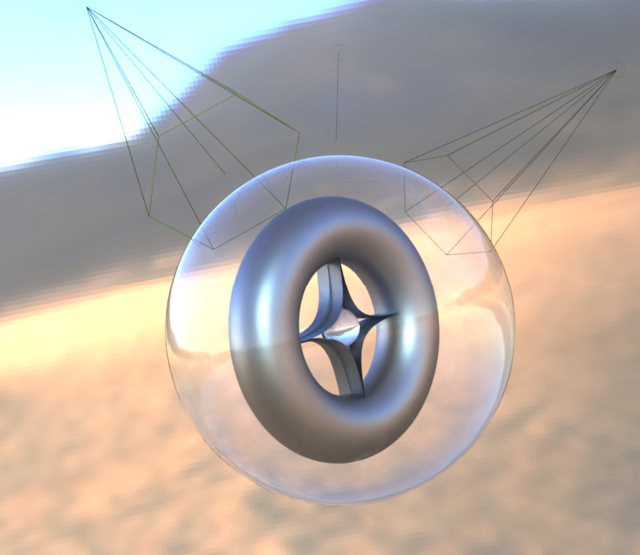
The Visualization Toolkit (VTK) is open source software for manipulating and displaying scientific data. It comes with state-of-the-art tools for 3D rendering, a suite of widgets for 3D interaction, and extensive 2D plotting capability.
VTK is part of Kitware’s collection of supported platforms for software development. The platform is used worldwide in commercial applications, as well as in research and development. For examples, please see VTK in Action.
VTK 9.5.0
The VTK release team is thrilled to announce the release of VTK 9.5.0, a significant update to the Visualization Toolkit! While this is a new minor version, v9.5.0 brings a host of new features, performance improvements, and important updates that continue to empower developers and researchers in creating cutting-edge scientific visualization applications. VTK 9.5 reflects […]
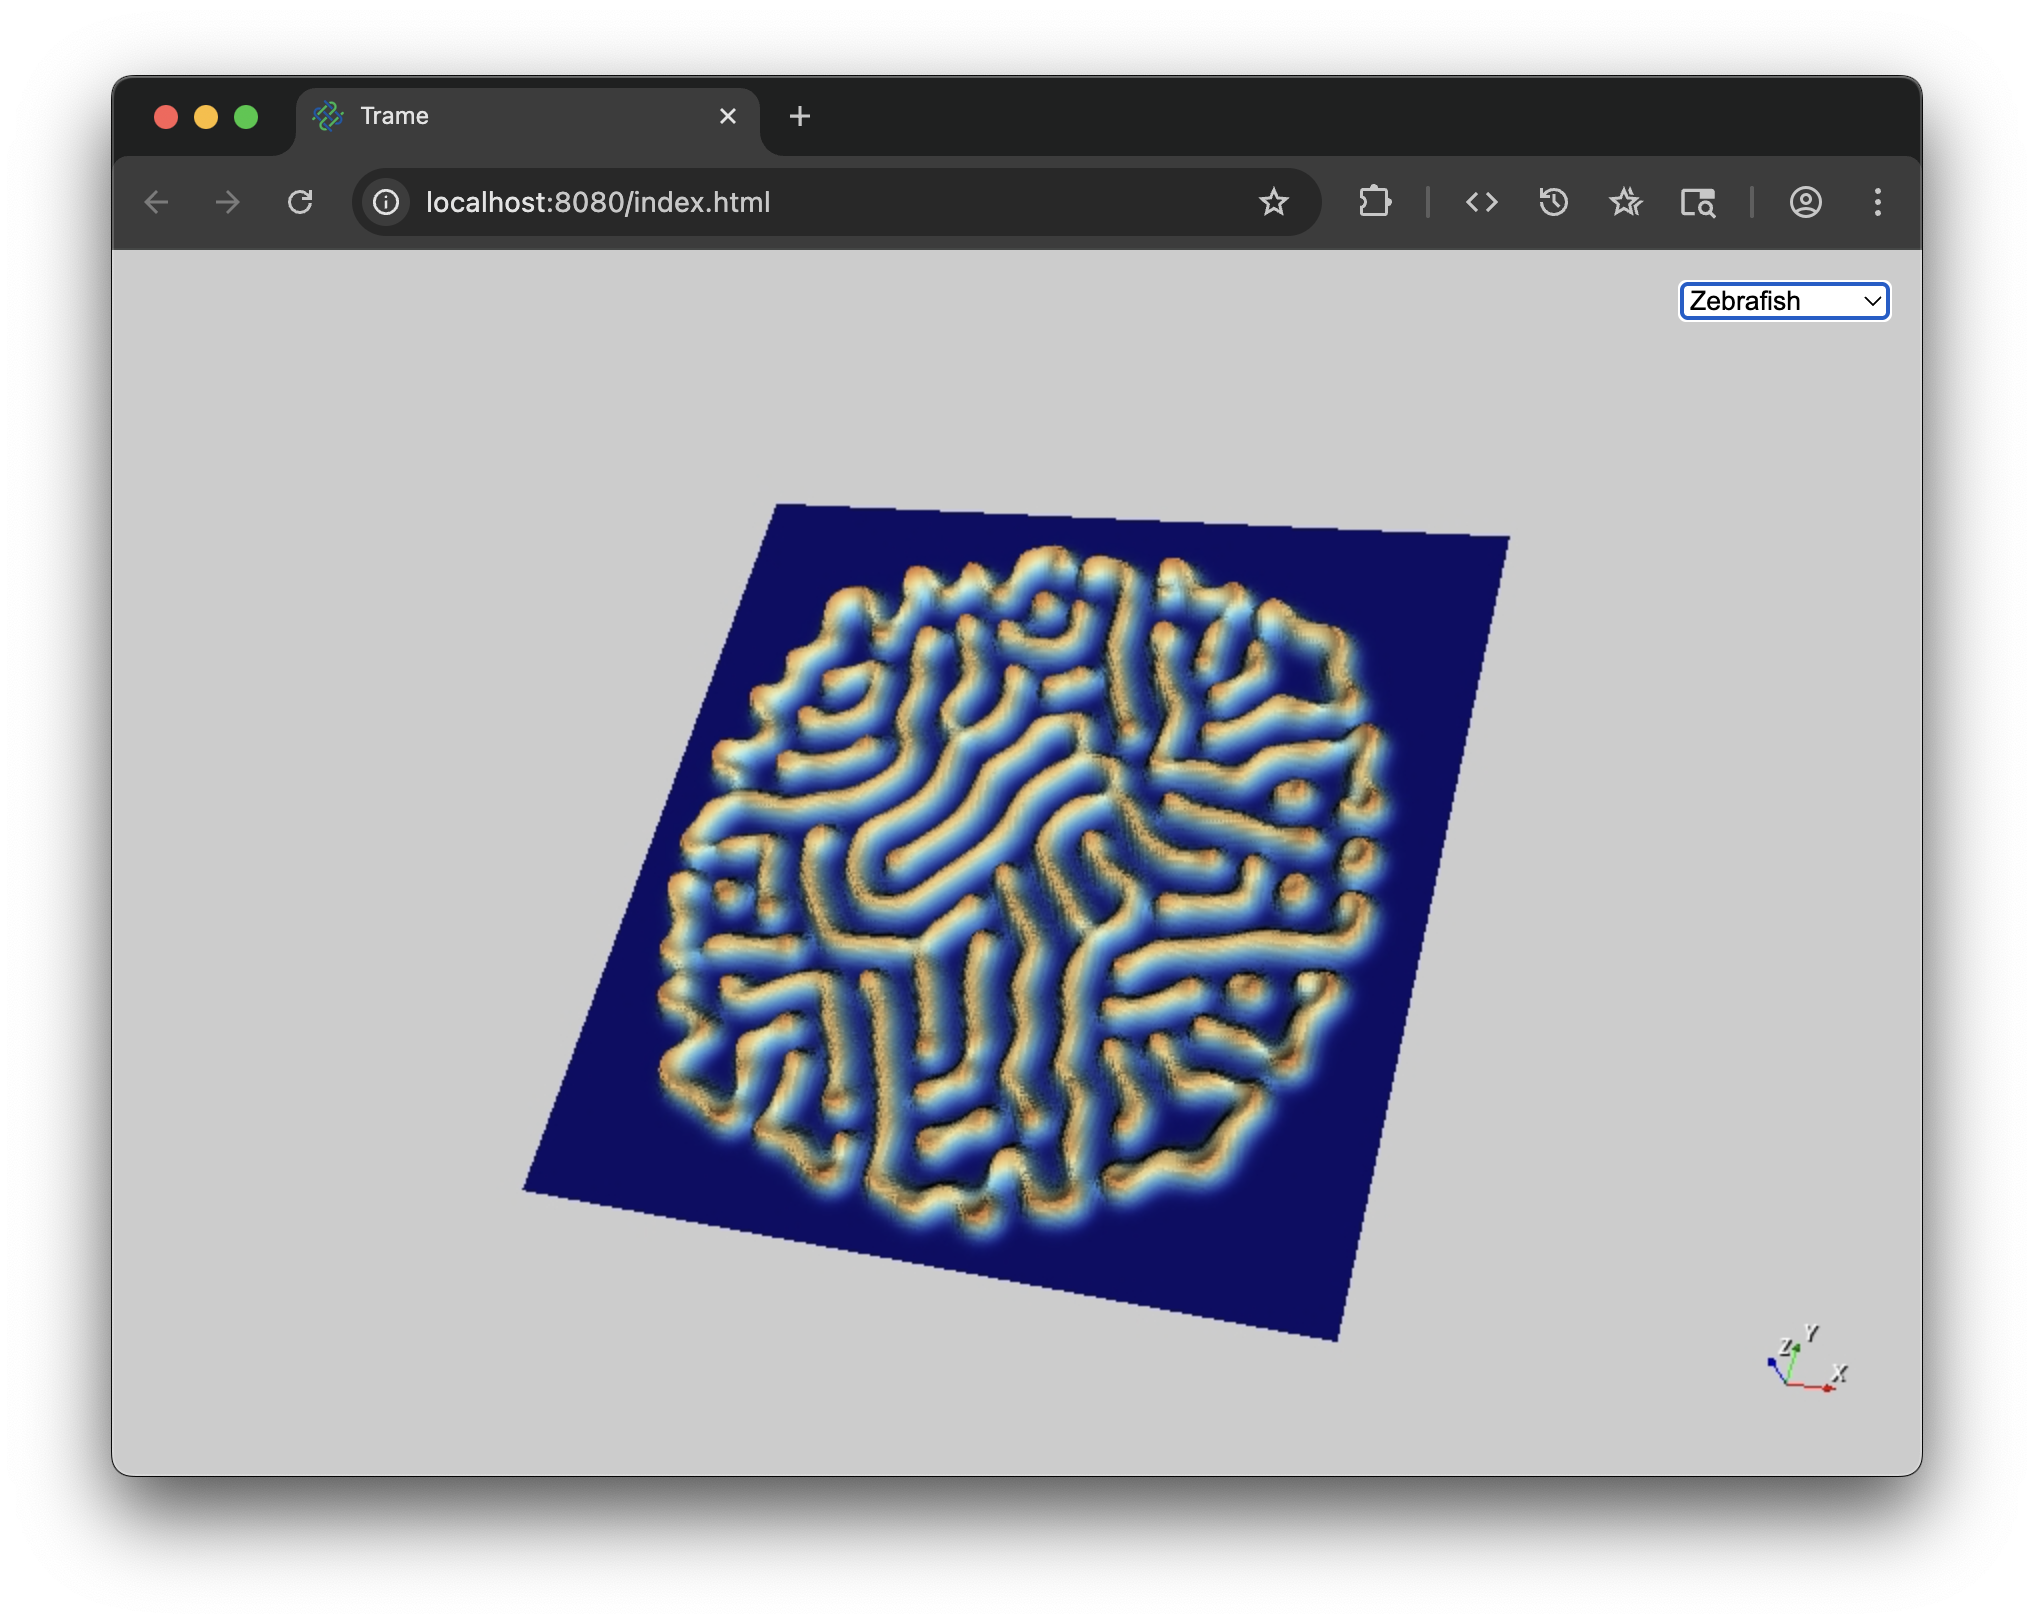
Faster, simpler Python application execution with uv and trame
Background & Motivation Trame has revolutionized how we build interactive scientific visualization applications in Python. By enabling developers to create rich graphical interfaces that seamlessly embed VTK/ParaView, Plotly, Matplotlib, and other visualization libraries with just Python scripts, trame has democratized access to powerful visualization tools. However, this convenience comes with a challenge that many trame […]
From Data to Discovery: Why VTK Remains the Go-To Platform for Visual Analytics
In a world where scientific data is growing in volume and complexity, visualizing that data in meaningful ways has never been more important. Whether you’re modeling fluid dynamics, exploring medical images, or developing advanced simulations, a reliable, high-performance visualization engine is essential.