MantisBT - ParaView |
| View Issue Details |
|
| ID | Project | Category | View Status | Date Submitted | Last Update |
| 0012281 | ParaView | (No Category) | public | 2011-06-15 19:20 | 2011-08-05 17:02 |
|
| Reporter | Ken Moreland | |
| Assigned To | Kyle Lutz | |
| Priority | normal | Severity | minor | Reproducibility | have not tried |
| Status | closed | Resolution | fixed | |
| Platform | | OS | | OS Version | |
| Product Version | 3.10.1 | |
| Target Version | | Fixed in Version | 3.12 | |
| Project | Sandia |
| Topic Name | 12281-fix-chart-label-precision-2 |
| Type | incorrect functionality |
|
| Summary | 0012281: Precision in x-y chart tooltip is fixed point |
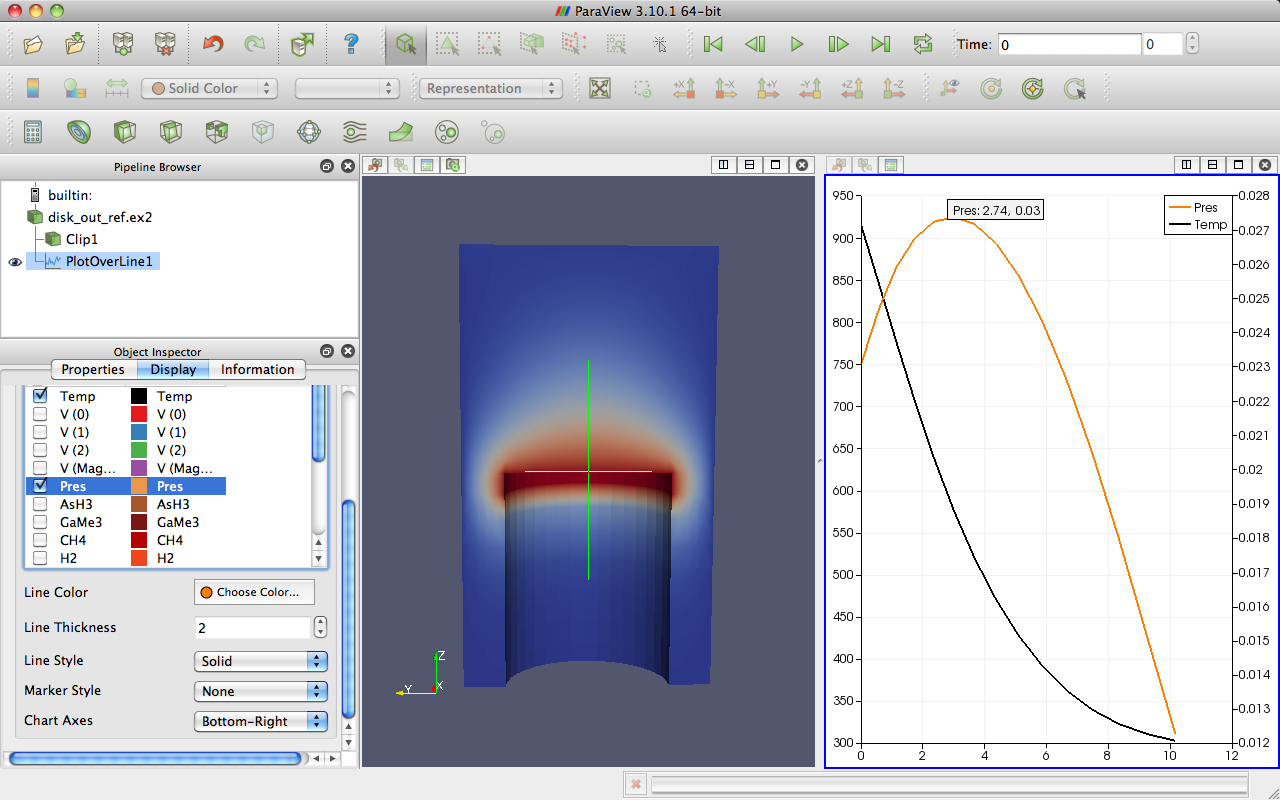
| Description | In the x-y chart there is a handy feature where you hover your mouse cursor over a line series and a tooltip pops up and reports the x/y coordinates of that point on the series. However, the numbers are given in fixed precision with two digits after the decimal point. If you have values with an absolute value of less than 0.1, you get very imprecise data (if any at all).
To replicate, load disk_out_ref, plot over line, turn off all series in the chart, then turn on one of the series with smaller values (such as AsH3, CH4, GaMe3, or Pres). Attached is a screenshot from the tutorial that also demonstrates this.
The tooltip should display a minimum of some number of significant digits. At a minimum 3. Perhaps 6 is a good value; it is the default for spreadsheets. |
| Steps To Reproduce | |
| Additional Information | |
| Tags | No tags attached. |
| Relationships | | has duplicate | 0012291 | closed | Utkarsh Ayachit | Precision in x-y chart tooltip is fixed | | has duplicate | 0012335 | closed | Ken Moreland | Number of visible digits of point data in graphs |
|
| Attached Files |  LinePlot3.png (189,202) 2011-06-15 19:20 LinePlot3.png (189,202) 2011-06-15 19:20
https://www.vtk.org/Bug/file/8941/LinePlot3.png
|
|
| Issue History |
| Date Modified | Username | Field | Change |
| 2011-06-15 19:20 | Ken Moreland | New Issue | |
| 2011-06-15 19:20 | Ken Moreland | File Added: LinePlot3.png | |
| 2011-06-16 17:26 | Ken Moreland | Project | => to be decided |
| 2011-06-16 17:26 | Ken Moreland | Type | => incorrect functionality |
| 2011-06-16 17:26 | Ken Moreland | Summary | Precision in x-y chart tooltip is fixed => Precision in x-y chart tooltip is fixed point |
| 2011-06-16 17:33 | Ken Moreland | Project | to be decided => Sandia |
| 2011-06-30 10:49 | Utkarsh Ayachit | Relationship added | has duplicate 0012291 |
| 2011-06-30 10:50 | Utkarsh Ayachit | Assigned To | => Kyle Lutz |
| 2011-06-30 11:18 | Kyle Lutz | Status | backlog => todo |
| 2011-07-01 11:01 | Kyle Lutz | Status | todo => active development |
| 2011-07-01 11:01 | Kyle Lutz | Note Added: 0026940 | |
| 2011-07-01 11:01 | Kyle Lutz | Status | active development => gatekeeper review |
| 2011-07-02 11:01 | Utkarsh Ayachit | Topic Name | => 12281-fix-chart-label-precision |
| 2011-07-05 11:25 | Ken Moreland | Relationship added | has duplicate 0012335 |
| 2011-07-08 10:32 | Utkarsh Ayachit | Note Added: 0026977 | |
| 2011-07-08 10:32 | Utkarsh Ayachit | Status | gatekeeper review => backlog |
| 2011-07-08 10:32 | Utkarsh Ayachit | Resolution | open => reopened |
| 2011-07-08 14:20 | Utkarsh Ayachit | Status | backlog => todo |
| 2011-07-08 14:20 | Utkarsh Ayachit | Status | todo => active development |
| 2011-07-08 14:20 | Utkarsh Ayachit | Status | active development => gatekeeper review |
| 2011-07-08 14:20 | Utkarsh Ayachit | Fixed in Version | => 3.12 |
| 2011-07-08 14:20 | Utkarsh Ayachit | Resolution | reopened => fixed |
| 2011-07-08 16:27 | Utkarsh Ayachit | Note Deleted: 0026977 | |
| 2011-07-08 16:27 | Utkarsh Ayachit | Status | gatekeeper review => customer review |
| 2011-08-01 09:02 | Kyle Lutz | Note Added: 0027179 | |
| 2011-08-01 11:08 | Ken Moreland | Note Added: 0027181 | |
| 2011-08-01 11:08 | Ken Moreland | Status | customer review => todo |
| 2011-08-01 15:35 | Kyle Lutz | Status | todo => active development |
| 2011-08-02 10:37 | Kyle Lutz | Topic Name | 12281-fix-chart-label-precision => 12281-fix-chart-label-precision-2 |
| 2011-08-02 10:37 | Kyle Lutz | Note Added: 0027200 | |
| 2011-08-02 10:37 | Kyle Lutz | Status | active development => gatekeeper review |
| 2011-08-02 10:50 | Kyle Lutz | Note Added: 0027201 | |
| 2011-08-02 10:52 | Kyle Lutz | Note Edited: 0027201 | bug_revision_view_page.php?bugnote_id=27201#r372 |
| 2011-08-02 14:06 | Kyle Lutz | Source_changeset_attached | => VTK master 05959606 |
| 2011-08-04 18:08 | Utkarsh Ayachit | Note Added: 0027241 | |
| 2011-08-05 10:41 | Andy Bauer | Note Added: 0027259 | |
| 2011-08-05 15:55 | Utkarsh Ayachit | Status | gatekeeper review => customer review |
| 2011-08-05 15:55 | Utkarsh Ayachit | Note Added: 0027279 | |
| 2011-08-05 17:02 | Ken Moreland | Note Added: 0027292 | |
| 2011-08-05 17:02 | Ken Moreland | Status | customer review => closed |
|
Notes |
|
|
(0026940)
|
|
Kyle Lutz
|
|
2011-07-01 11:01
|
|
Merge topic '12281-fix-chart-label-precision' into pv-next
0595960 Fix label precision handling in vtkPlot |
|
|
|
(0027179)
|
|
Kyle Lutz
|
|
2011-08-01 09:02
|
|
|
To change the displayed precision you can use the View Settings dialog by clicking the button in the upper-left of the plot view. You can then select an axis and change the display precision and/or notation. This will allow you to view more significant figures in the tooltip when hovering over a line. |
|
|
|
(0027181)
|
|
Ken Moreland
|
|
2011-08-01 11:08
|
|
I see a few problems with the implementation.
First, the location of the setting makes no sense. It is labeled as Precision (fine) under Axis Labels (huh?) under a specific Axis (huh?). I, as a user, expect all options under any of the Left/Bottom/Right/Top Axis categories to specifically control how that axis is drawn, not text in some box in the middle of the plot. In fact, the setting is located with all the other controls that deal with the fonts of those axis labels. Had you not specifically told me to change that particular GUI widget, I would never have tried it in the first place.
There should be a singular setting either in the General tab under a "Tooltip" label or in its own Tooltip tab. The latter is a nice idea because you could add other font options for the tooltip. In either case, the option then applies to the precision of any value from any axis and any series.
Second, the default value needs to change. 2 is unnecessarily small. Make it at least 4. I suggest 6, as that is the default value in the spreadsheet. In any case we should expect the value in the tooltip to be more precise than that drawn in the axis. That's basically the point.
Third, the precision controls the number of fixed digits after the decimal point. This is wrong. The precision should control the number of significant digits. So, for example, when displaying the number 0.00123456 with precision 2, you should get 0.0012, not 0.00 (as you would get now). When displaying the number 123,456 with precision 2, you only need to display 1.2e5 (although displaying 123456 would be OK, too). |
|
|
|
(0027200)
|
|
Kyle Lutz
|
|
2011-08-02 10:37
|
|
Merge topic '12281-fix-chart-label-precision-2' into next
72f0da0 Add chart tooltip notation and precision variables |
|
|
|
(0027201)
|
|
Kyle Lutz
|
2011-08-02 10:50
(edited on: 2011-08-02 10:52) |
|
Alright, attempt #2 :-).
Under the "View Settings" dialog for the plot there is now a "Tooltip" section which allows you to set the notation (standard, scientific, or fixed) and precision for the tooltip to display. This is now independent of the settings for the axes and the default precision is set at 6.
Let me know what you think.
|
|
|
|
(0027241)
|
|
Utkarsh Ayachit
|
|
2011-08-04 18:08
|
|
|
Developer note: Issue slated for gatekeeper review on Aug 7, 2 PM EDT. |
|
|
|
(0027259)
|
|
Andy Bauer
|
|
2011-08-05 10:41
|
|
|
Appears to be working fine. Has 6 significant digits being displayed unless the last digits are 0 though (e.g. 1/20 would be displayed as 0.05 instead of 0.0500000). Assuming this is ok though. If not, please add this to the issue. |
|
|
|
(0027279)
|
|
Utkarsh Ayachit
|
|
2011-08-05 15:55
|
|
|
Merged into master (if applicable) |
|
|
|
(0027292)
|
|
Ken Moreland
|
|
2011-08-05 17:02
|
|
|