vtkChartXY Class Reference
#include <vtkChartXY.h>

Detailed Description
Factory class for drawing XY charts.This class implements an XY chart.
- See also:
- vtkBarChartActor
- Examples:
- vtkChartXY (Examples)
- Tests:
- vtkChartXY (Tests)
Definition at line 46 of file vtkChartXY.h.
Public Types | |
| typedef vtkChart | Superclass |
Public Member Functions | |
| virtual const char * | GetClassName () |
| virtual int | IsA (const char *type) |
| virtual void | PrintSelf (ostream &os, vtkIndent indent) |
| virtual void | Update () |
| virtual bool | Paint (vtkContext2D *painter) |
| virtual vtkPlot * | AddPlot (int type) |
| virtual vtkIdType | AddPlot (vtkPlot *plot) |
| virtual bool | RemovePlot (vtkIdType index) |
| virtual void | ClearPlots () |
| virtual vtkPlot * | GetPlot (vtkIdType index) |
| virtual vtkIdType | GetNumberOfPlots () |
| int | GetPlotCorner (vtkPlot *plot) |
| void | SetPlotCorner (vtkPlot *plot, int corner) |
| virtual vtkAxis * | GetAxis (int axisIndex) |
| virtual void | SetShowLegend (bool visible) |
| virtual vtkChartLegend * | GetLegend () |
| virtual vtkTooltipItem * | GetTooltip () |
| virtual vtkIdType | GetNumberOfAxes () |
| virtual void | RecalculateBounds () |
| virtual bool | Hit (const vtkContextMouseEvent &mouse) |
| virtual bool | MouseEnterEvent (const vtkContextMouseEvent &mouse) |
| virtual bool | MouseMoveEvent (const vtkContextMouseEvent &mouse) |
| virtual bool | MouseLeaveEvent (const vtkContextMouseEvent &mouse) |
| virtual bool | MouseButtonPressEvent (const vtkContextMouseEvent &mouse) |
| virtual bool | MouseButtonReleaseEvent (const vtkContextMouseEvent &mouse) |
| virtual void | SetDrawAxesAtOrigin (bool) |
| virtual bool | GetDrawAxesAtOrigin () |
| virtual void | DrawAxesAtOriginOn () |
| virtual void | DrawAxesAtOriginOff () |
| virtual void | SetAutoAxes (bool) |
| virtual bool | GetAutoAxes () |
| virtual void | AutoAxesOn () |
| virtual void | AutoAxesOff () |
| virtual void | SetHiddenAxisBorder (int) |
| virtual int | GetHiddenAxisBorder () |
| virtual void | SetForceAxesToBounds (bool) |
| virtual bool | GetForceAxesToBounds () |
| virtual void | ForceAxesToBoundsOn () |
| virtual void | ForceAxesToBoundsOff () |
| virtual void | SetBarWidthFraction (float) |
| virtual float | GetBarWidthFraction () |
| virtual void | SetTooltipInfo (const vtkContextMouseEvent &, const vtkVector2f &, vtkIdType, vtkPlot *, vtkIdType segmentIndex=-1) |
| virtual bool | MouseWheelEvent (const vtkContextMouseEvent &mouse, int delta) |
Static Public Member Functions | |
| static int | IsTypeOf (const char *type) |
| static vtkChartXY * | SafeDownCast (vtkObject *o) |
| static vtkChartXY * | New () |
Protected Member Functions | |
| vtkChartXY () | |
| ~vtkChartXY () | |
| void | RecalculatePlotTransforms () |
| void | RecalculatePlotBounds () |
| virtual bool | UpdateLayout (vtkContext2D *painter) |
| virtual int | GetLegendBorder (vtkContext2D *painter, int axisPosition) |
| virtual void | SetLegendPosition (const vtkRectf &rect) |
Protected Attributes | |
| vtkSmartPointer< vtkChartLegend > | Legend |
| vtkSmartPointer< vtkTooltipItem > | Tooltip |
| bool | PlotTransformValid |
| vtkRectf | MouseBox |
| bool | DrawBox |
| bool | DrawNearestPoint |
| bool | DrawAxesAtOrigin |
| bool | AutoAxes |
| int | HiddenAxisBorder |
| float | BarWidthFraction |
| bool | LayoutChanged |
| bool | ForceAxesToBounds |
Member Typedef Documentation
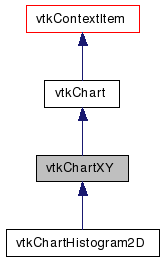
| typedef vtkChart vtkChartXY::Superclass |
Reimplemented from vtkChart.
Reimplemented in vtkChartHistogram2D.
Definition at line 49 of file vtkChartXY.h.
Constructor & Destructor Documentation
| vtkChartXY::vtkChartXY | ( | ) | [protected] |
| vtkChartXY::~vtkChartXY | ( | ) | [protected] |
Member Function Documentation
| virtual const char* vtkChartXY::GetClassName | ( | ) | [virtual] |
| static int vtkChartXY::IsTypeOf | ( | const char * | name | ) | [static] |
Return 1 if this class type is the same type of (or a subclass of) the named class. Returns 0 otherwise. This method works in combination with vtkTypeMacro found in vtkSetGet.h.
Reimplemented from vtkChart.
Reimplemented in vtkChartHistogram2D.
| virtual int vtkChartXY::IsA | ( | const char * | name | ) | [virtual] |
Return 1 if this class is the same type of (or a subclass of) the named class. Returns 0 otherwise. This method works in combination with vtkTypeMacro found in vtkSetGet.h.
Reimplemented from vtkChart.
Reimplemented in vtkChartHistogram2D.
| static vtkChartXY* vtkChartXY::SafeDownCast | ( | vtkObject * | o | ) | [static] |
| virtual void vtkChartXY::PrintSelf | ( | ostream & | os, | |
| vtkIndent | indent | |||
| ) | [virtual] |
Methods invoked by print to print information about the object including superclasses. Typically not called by the user (use Print() instead) but used in the hierarchical print process to combine the output of several classes.
Reimplemented from vtkChart.
Reimplemented in vtkChartHistogram2D.
| static vtkChartXY* vtkChartXY::New | ( | ) | [static] |
| virtual void vtkChartXY::Update | ( | ) | [virtual] |
Perform any updates to the item that may be necessary before rendering. The scene should take care of calling this on all items before their Paint function is invoked.
Reimplemented from vtkAbstractContextItem.
Reimplemented in vtkChartHistogram2D.
| virtual bool vtkChartXY::Paint | ( | vtkContext2D * | painter | ) | [virtual] |
Paint event for the chart, called whenever the chart needs to be drawn
Implements vtkChart.
| virtual vtkPlot* vtkChartXY::AddPlot | ( | int | type | ) | [virtual] |
Add a plot to the chart, defaults to using the name of the y column
Reimplemented from vtkChart.
Adds a plot to the chart
Reimplemented from vtkChart.
| virtual bool vtkChartXY::RemovePlot | ( | vtkIdType | index | ) | [virtual] |
Remove the plot at the specified index, returns true if successful, false if the index was invalid.
Reimplemented from vtkChart.
| virtual void vtkChartXY::ClearPlots | ( | ) | [virtual] |
Remove all plots from the chart.
Reimplemented from vtkChart.
Get the plot at the specified index, returns null if the index is invalid.
Reimplemented from vtkChart.
| virtual vtkIdType vtkChartXY::GetNumberOfPlots | ( | ) | [virtual] |
Get the number of plots the chart contains.
Reimplemented from vtkChart.
| int vtkChartXY::GetPlotCorner | ( | vtkPlot * | plot | ) |
Figure out which quadrant the plot is in.
| void vtkChartXY::SetPlotCorner | ( | vtkPlot * | plot, | |
| int | corner | |||
| ) |
Figure out which quadrant the plot is in.
| virtual vtkAxis* vtkChartXY::GetAxis | ( | int | axisIndex | ) | [virtual] |
Get the axis specified by axisIndex. This is specified with the vtkAxis position enum, valid values are vtkAxis::LEFT, vtkAxis::BOTTOM, vtkAxis::RIGHT and vtkAxis::TOP.
Reimplemented from vtkChart.
| virtual void vtkChartXY::SetShowLegend | ( | bool | visible | ) | [virtual] |
Set whether the chart should draw a legend.
Reimplemented from vtkChart.
| virtual vtkChartLegend* vtkChartXY::GetLegend | ( | ) | [virtual] |
Get the vtkChartLegend object that will be displayed by the chart.
Reimplemented from vtkChart.
| virtual vtkTooltipItem* vtkChartXY::GetTooltip | ( | ) | [virtual] |
Get the vtkTooltipItem object that will be displayed by the chart.
| virtual vtkIdType vtkChartXY::GetNumberOfAxes | ( | ) | [virtual] |
Get the number of axes in the current chart.
Reimplemented from vtkChart.
| virtual void vtkChartXY::RecalculateBounds | ( | ) | [virtual] |
Request that the chart recalculates the range of its axes. Especially useful in applications after the parameters of plots have been modified.
Reimplemented from vtkChart.
| virtual void vtkChartXY::SetDrawAxesAtOrigin | ( | bool | ) | [virtual] |
If true then the axes will be drawn at the origin (scientific style).
| virtual bool vtkChartXY::GetDrawAxesAtOrigin | ( | ) | [virtual] |
If true then the axes will be drawn at the origin (scientific style).
| virtual void vtkChartXY::DrawAxesAtOriginOn | ( | ) | [virtual] |
If true then the axes will be drawn at the origin (scientific style).
| virtual void vtkChartXY::DrawAxesAtOriginOff | ( | ) | [virtual] |
If true then the axes will be drawn at the origin (scientific style).
| virtual void vtkChartXY::SetAutoAxes | ( | bool | ) | [virtual] |
If true then the axes will be turned on and off depending upon whether any plots are in that corner. Defaults to true.
| virtual bool vtkChartXY::GetAutoAxes | ( | ) | [virtual] |
If true then the axes will be turned on and off depending upon whether any plots are in that corner. Defaults to true.
| virtual void vtkChartXY::AutoAxesOn | ( | ) | [virtual] |
If true then the axes will be turned on and off depending upon whether any plots are in that corner. Defaults to true.
| virtual void vtkChartXY::AutoAxesOff | ( | ) | [virtual] |
If true then the axes will be turned on and off depending upon whether any plots are in that corner. Defaults to true.
| virtual void vtkChartXY::SetHiddenAxisBorder | ( | int | ) | [virtual] |
Border size of the axes that are hidden (vtkAxis::GetVisible())
| virtual int vtkChartXY::GetHiddenAxisBorder | ( | ) | [virtual] |
Border size of the axes that are hidden (vtkAxis::GetVisible())
| virtual void vtkChartXY::SetForceAxesToBounds | ( | bool | ) | [virtual] |
Force the axes to have their Minimum and Maximum properties inside the plot boundaries. It constrains pan and zoom interaction. False by default.
| virtual bool vtkChartXY::GetForceAxesToBounds | ( | ) | [virtual] |
Force the axes to have their Minimum and Maximum properties inside the plot boundaries. It constrains pan and zoom interaction. False by default.
| virtual void vtkChartXY::ForceAxesToBoundsOn | ( | ) | [virtual] |
Force the axes to have their Minimum and Maximum properties inside the plot boundaries. It constrains pan and zoom interaction. False by default.
| virtual void vtkChartXY::ForceAxesToBoundsOff | ( | ) | [virtual] |
Force the axes to have their Minimum and Maximum properties inside the plot boundaries. It constrains pan and zoom interaction. False by default.
| virtual void vtkChartXY::SetBarWidthFraction | ( | float | ) | [virtual] |
Set the width fraction for any bar charts drawn in this chart. It is assumed that all bar plots will use the same array for the X axis, and that this array is regularly spaced. The delta between the first two x values is used to calculated the width of the bars, and subdivided between each bar. The default value is 0.8, 1.0 would lead to bars that touch.
| virtual float vtkChartXY::GetBarWidthFraction | ( | ) | [virtual] |
Set the width fraction for any bar charts drawn in this chart. It is assumed that all bar plots will use the same array for the X axis, and that this array is regularly spaced. The delta between the first two x values is used to calculated the width of the bars, and subdivided between each bar. The default value is 0.8, 1.0 would lead to bars that touch.
| virtual void vtkChartXY::SetTooltipInfo | ( | const vtkContextMouseEvent & | , | |
| const vtkVector2f & | , | |||
| vtkIdType | , | |||
| vtkPlot * | , | |||
| vtkIdType | segmentIndex = -1 | |||
| ) | [virtual] |
Set the information passed to the tooltip.
| virtual bool vtkChartXY::Hit | ( | const vtkContextMouseEvent & | mouse | ) | [virtual] |
Return true if the supplied x, y coordinate is inside the item.
Reimplemented from vtkAbstractContextItem.
Reimplemented in vtkChartHistogram2D.
| virtual bool vtkChartXY::MouseEnterEvent | ( | const vtkContextMouseEvent & | mouse | ) | [virtual] |
Mouse enter event.
Reimplemented from vtkAbstractContextItem.
| virtual bool vtkChartXY::MouseMoveEvent | ( | const vtkContextMouseEvent & | mouse | ) | [virtual] |
Mouse move event.
Reimplemented from vtkAbstractContextItem.
| virtual bool vtkChartXY::MouseLeaveEvent | ( | const vtkContextMouseEvent & | mouse | ) | [virtual] |
Mouse leave event.
Reimplemented from vtkAbstractContextItem.
| virtual bool vtkChartXY::MouseButtonPressEvent | ( | const vtkContextMouseEvent & | mouse | ) | [virtual] |
Mouse button down event
Reimplemented from vtkAbstractContextItem.
| virtual bool vtkChartXY::MouseButtonReleaseEvent | ( | const vtkContextMouseEvent & | mouse | ) | [virtual] |
Mouse button release event.
Reimplemented from vtkAbstractContextItem.
| virtual bool vtkChartXY::MouseWheelEvent | ( | const vtkContextMouseEvent & | mouse, | |
| int | delta | |||
| ) | [virtual] |
Mouse wheel event, positive delta indicates forward movement of the wheel.
Reimplemented from vtkAbstractContextItem.
| void vtkChartXY::RecalculatePlotTransforms | ( | ) | [protected] |
Recalculate the necessary transforms.
| void vtkChartXY::RecalculatePlotBounds | ( | ) | [protected] |
Calculate the optimal zoom level such that all of the points to be plotted will fit into the plot area.
| virtual bool vtkChartXY::UpdateLayout | ( | vtkContext2D * | painter | ) | [protected, virtual] |
Update the layout of the chart, this may require the vtkContext2D in order to get font metrics etc. Initially this was added to resize the charts according in response to the size of the axes.
Reimplemented in vtkChartHistogram2D.
| virtual int vtkChartXY::GetLegendBorder | ( | vtkContext2D * | painter, | |
| int | axisPosition | |||
| ) | [protected, virtual] |
Layout for the legend if it is visible. This is run after the axes layout and will adjust the borders to account for the legend position.
- Returns:
- The required space in the specified border.
| virtual void vtkChartXY::SetLegendPosition | ( | const vtkRectf & | rect | ) | [protected, virtual] |
Called after the edges of the chart are decided, set the position of the legend, depends upon its alignment.
Member Data Documentation
vtkSmartPointer<vtkChartLegend> vtkChartXY::Legend [protected] |
The legend for the chart.
Definition at line 214 of file vtkChartXY.h.
vtkSmartPointer<vtkTooltipItem> vtkChartXY::Tooltip [protected] |
The tooltip item for the chart - can be used to display extra information.
Definition at line 218 of file vtkChartXY.h.
bool vtkChartXY::PlotTransformValid [protected] |
Does the plot area transform need to be recalculated?
Definition at line 221 of file vtkChartXY.h.
vtkRectf vtkChartXY::MouseBox [protected] |
The box created as the mouse is dragged around the screen.
Definition at line 224 of file vtkChartXY.h.
bool vtkChartXY::DrawBox [protected] |
Should the box be drawn (could be selection, zoom etc).
Definition at line 227 of file vtkChartXY.h.
bool vtkChartXY::DrawNearestPoint [protected] |
Should we draw the location of the nearest point on the plot?
Definition at line 230 of file vtkChartXY.h.
bool vtkChartXY::DrawAxesAtOrigin [protected] |
Keep the axes drawn at the origin? This will attempt to keep the axes drawn at the origin, i.e. 0.0, 0.0 for the chart. This is often the preferred way of drawing scientific/mathematical charts.
Definition at line 235 of file vtkChartXY.h.
bool vtkChartXY::AutoAxes [protected] |
Should axes be turned on and off automatically - defaults to on.
Definition at line 238 of file vtkChartXY.h.
int vtkChartXY::HiddenAxisBorder [protected] |
Size of the border when an axis is hidden
Definition at line 241 of file vtkChartXY.h.
float vtkChartXY::BarWidthFraction [protected] |
The fraction of the interval taken up along the x axis by any bars that are drawn on the chart.
Definition at line 245 of file vtkChartXY.h.
bool vtkChartXY::LayoutChanged [protected] |
Indicate if the layout has changed in some way that would require layout code to be called.
Definition at line 249 of file vtkChartXY.h.
bool vtkChartXY::ForceAxesToBounds [protected] |
Property to force the axes to have their Minimum and Maximum properties inside the plot boundaries. It constrains pan and zoom interaction. False by default.
Definition at line 254 of file vtkChartXY.h.
The documentation for this class was generated from the following file:
- dox/Charts/vtkChartXY.h