Leverage the power of VTK by partnering with Kitware
What It's Like to Work with Us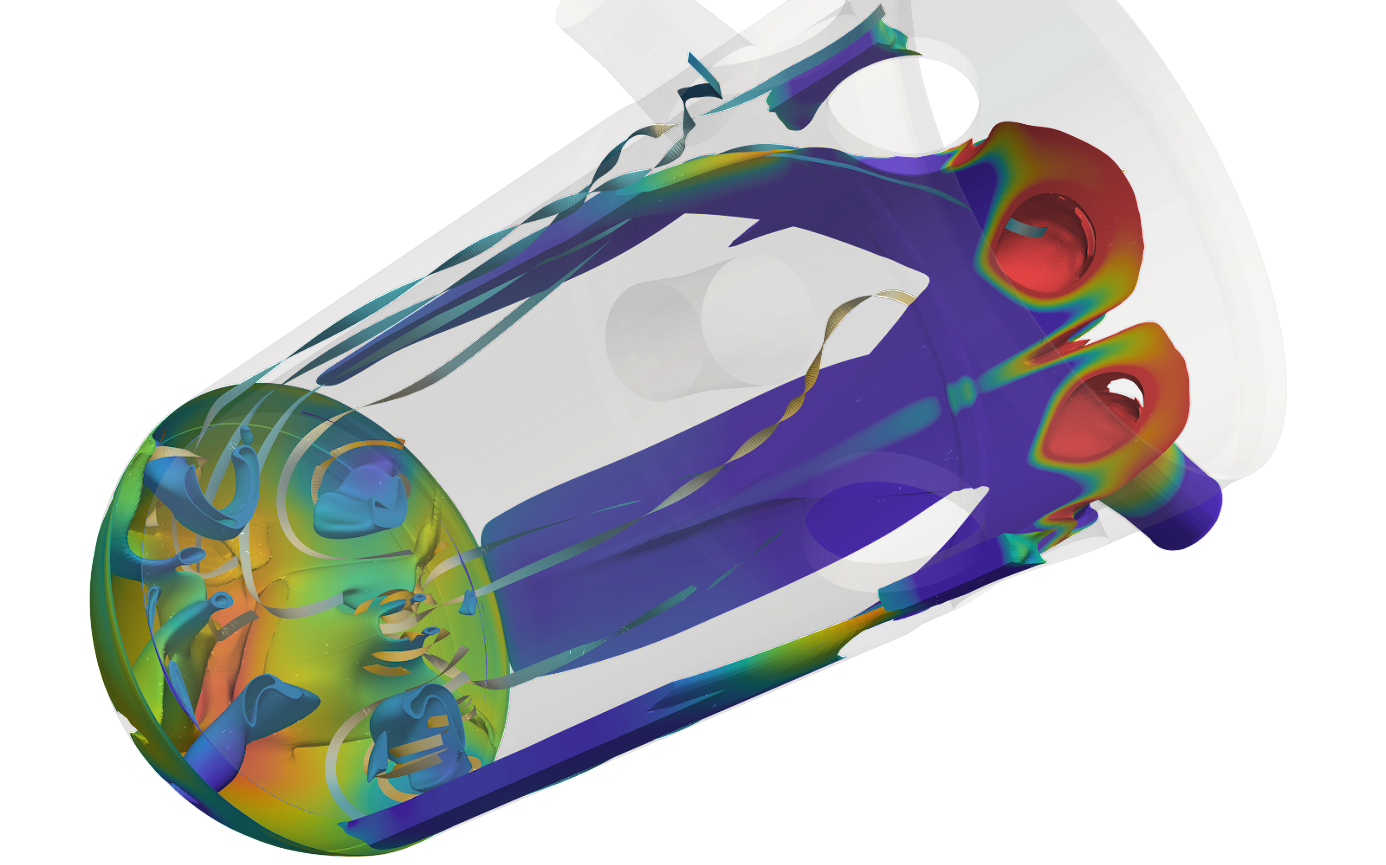
Process images and create 3D computer graphics with the Visualization Toolkit.
The Visualization Toolkit (VTK) is open source software for manipulating and displaying scientific data. It comes with state-of-the-art tools for 3D rendering, a suite of widgets for 3D interaction, and extensive 2D plotting capability.
VTK is part of Kitware’s collection of supported platforms for software development. The platform is used worldwide in commercial applications, as well as in research and development. For examples, please see VTK in Action.

M&M 2026
Kitware is pleased to be returning to the Microscopy & Microanalysis (M&M) conference. This year, we will be exhibiting and hosting a vendor tutorial about the Tomviz 3.0 release. We also had a platform presentation accepted on our DOE Phase II-funded open source multivariate visualization work. Visit us at Booth #1222 to learn more, or contact our team to schedule a meeting.
One PolyData Mapper Instead of Two: Measuring Vertex Pulling on the Desktop
VTK ships two OpenGL polydata mappers that do the same job two different ways. We maintain both. I wrote the second WebGL2/GLES3.0 mapper back in 2023 due to a need for polydata rendering in VTK.wasm using vertex pulling. It’s called vertex pulling since it’s the vertex shader that decides which vertex data to read vs the traditional way where vertex data is supplied automatically via attributes. The historical reason for keeping them separate was a performance belief: vertex pulling is too slow for the desktop. We turned that belief into measurements on a native NVIDIA GL stack, and it does not hold up. With a two-line change: an indexed draw, vertex pulling can match the classic interleaved-VBO mapper on GPU time across every workload we tried, it carries a realistic 4-attribute vertex with no penalty, and adds zero CPU overhead per frame. The assumption that kept the mappers apart is no longer relevant. This post shows the numbers and argues we should merge the two mappers.
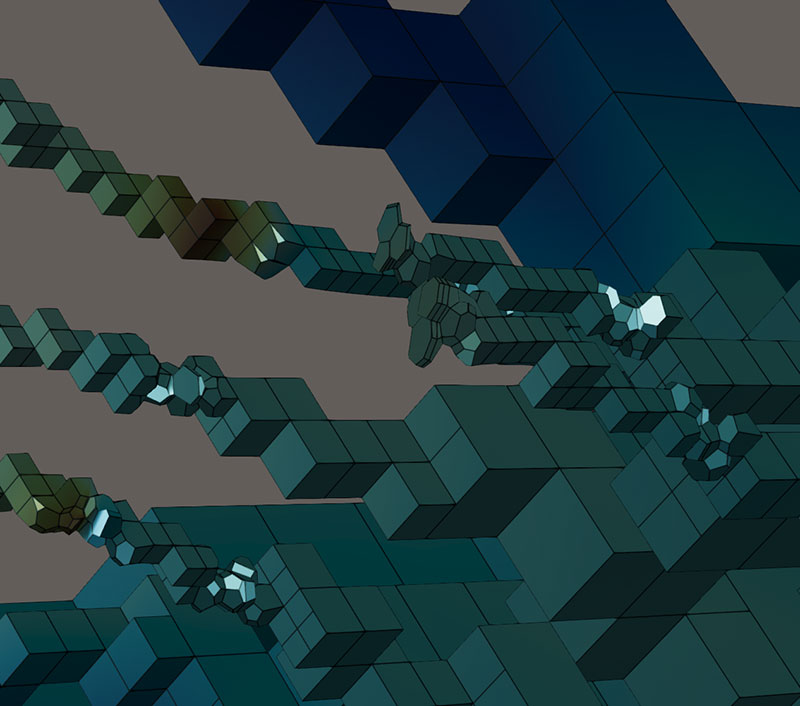
Polyhedron Processing Improvements in VTK
Polyhedral cells (general convex or non-convex 3D cells with arbitrary face and vertex counts) appear throughout large-scale simulation, particularly in CFD. Some solvers produce them as the dual of a tetrahedral mesh; others use them as transition cells across refinement boundaries; still others build directly on face-based polyhedral connectivity as the native primitive. Several commercial and open source CFD codes have invested in face-based arbitrary polyhedral cells as a first-class primitive, and that investment runs all the way through the pre- and post-processing pipeline because handling polyhedra well at every stage is non-trivial.