Do you have something to share?
Send an image, a caption, and a link to your VTK project to show the community.
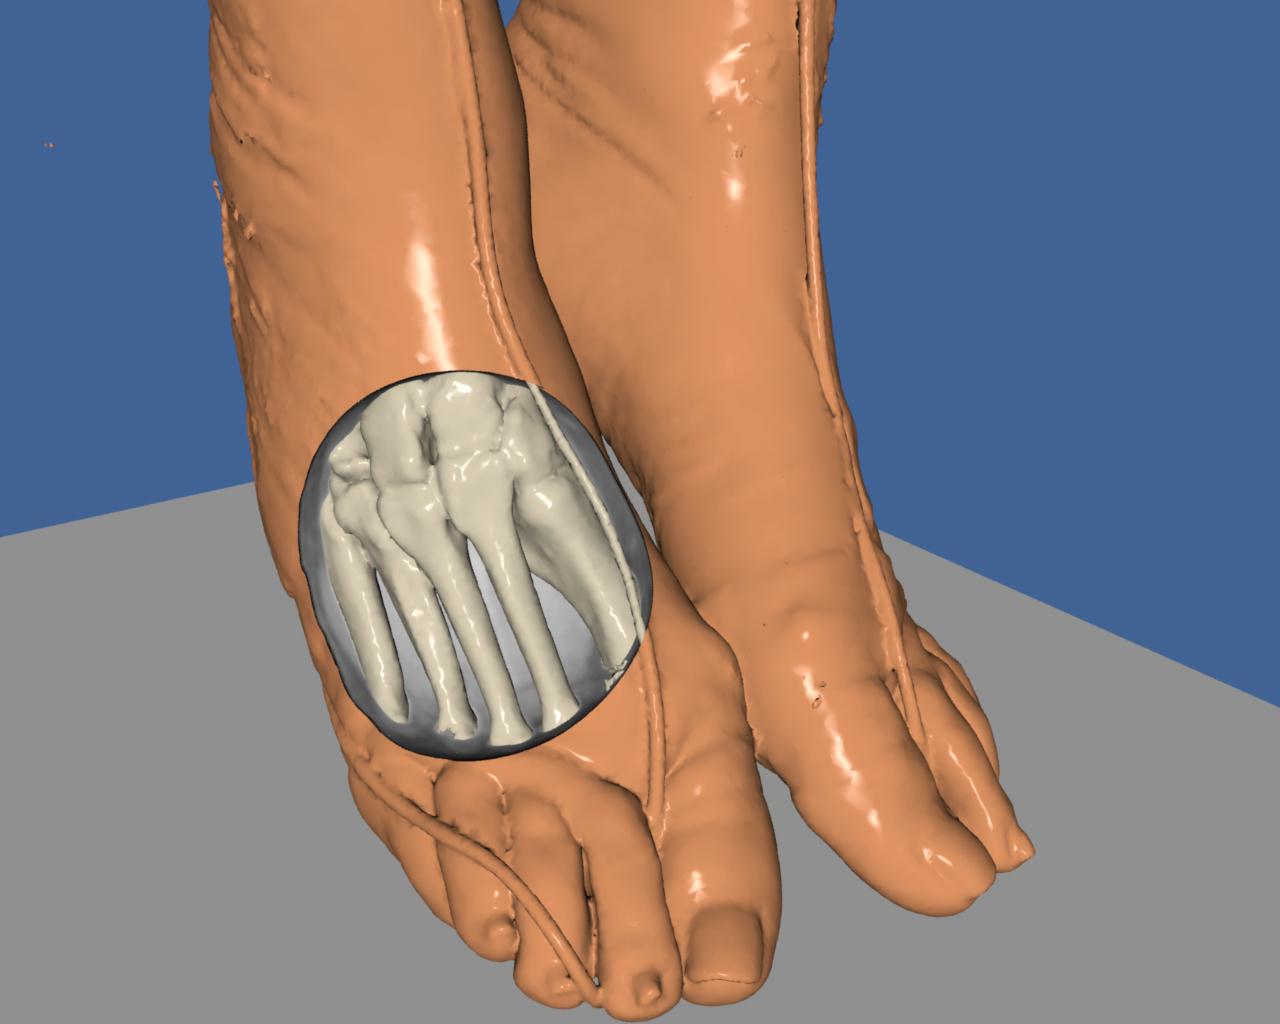
full_womanFoot
CT scan from the visible woman dataset. An isosurface of the skin is clipped with a sphere to reveal the underlying bone structure. Author: Original visualization author Bill Lorensen.
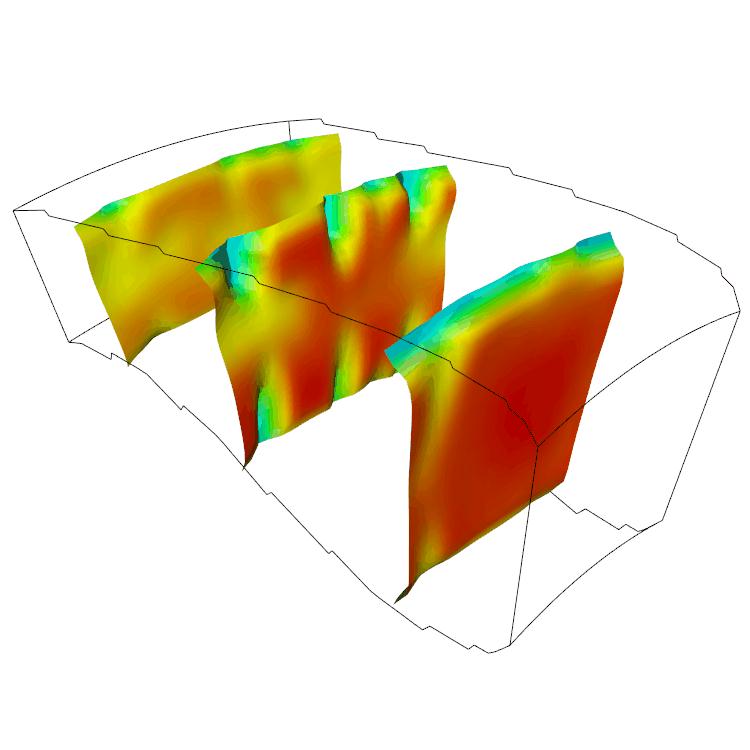
full_warpComb
Visualization the combustion process in a segment of an annular combustor. The combustor is where fuel and air is burned in a gas turbine. Author: VTK Textbook (Schroeder, Martin, Lorensen et al.)
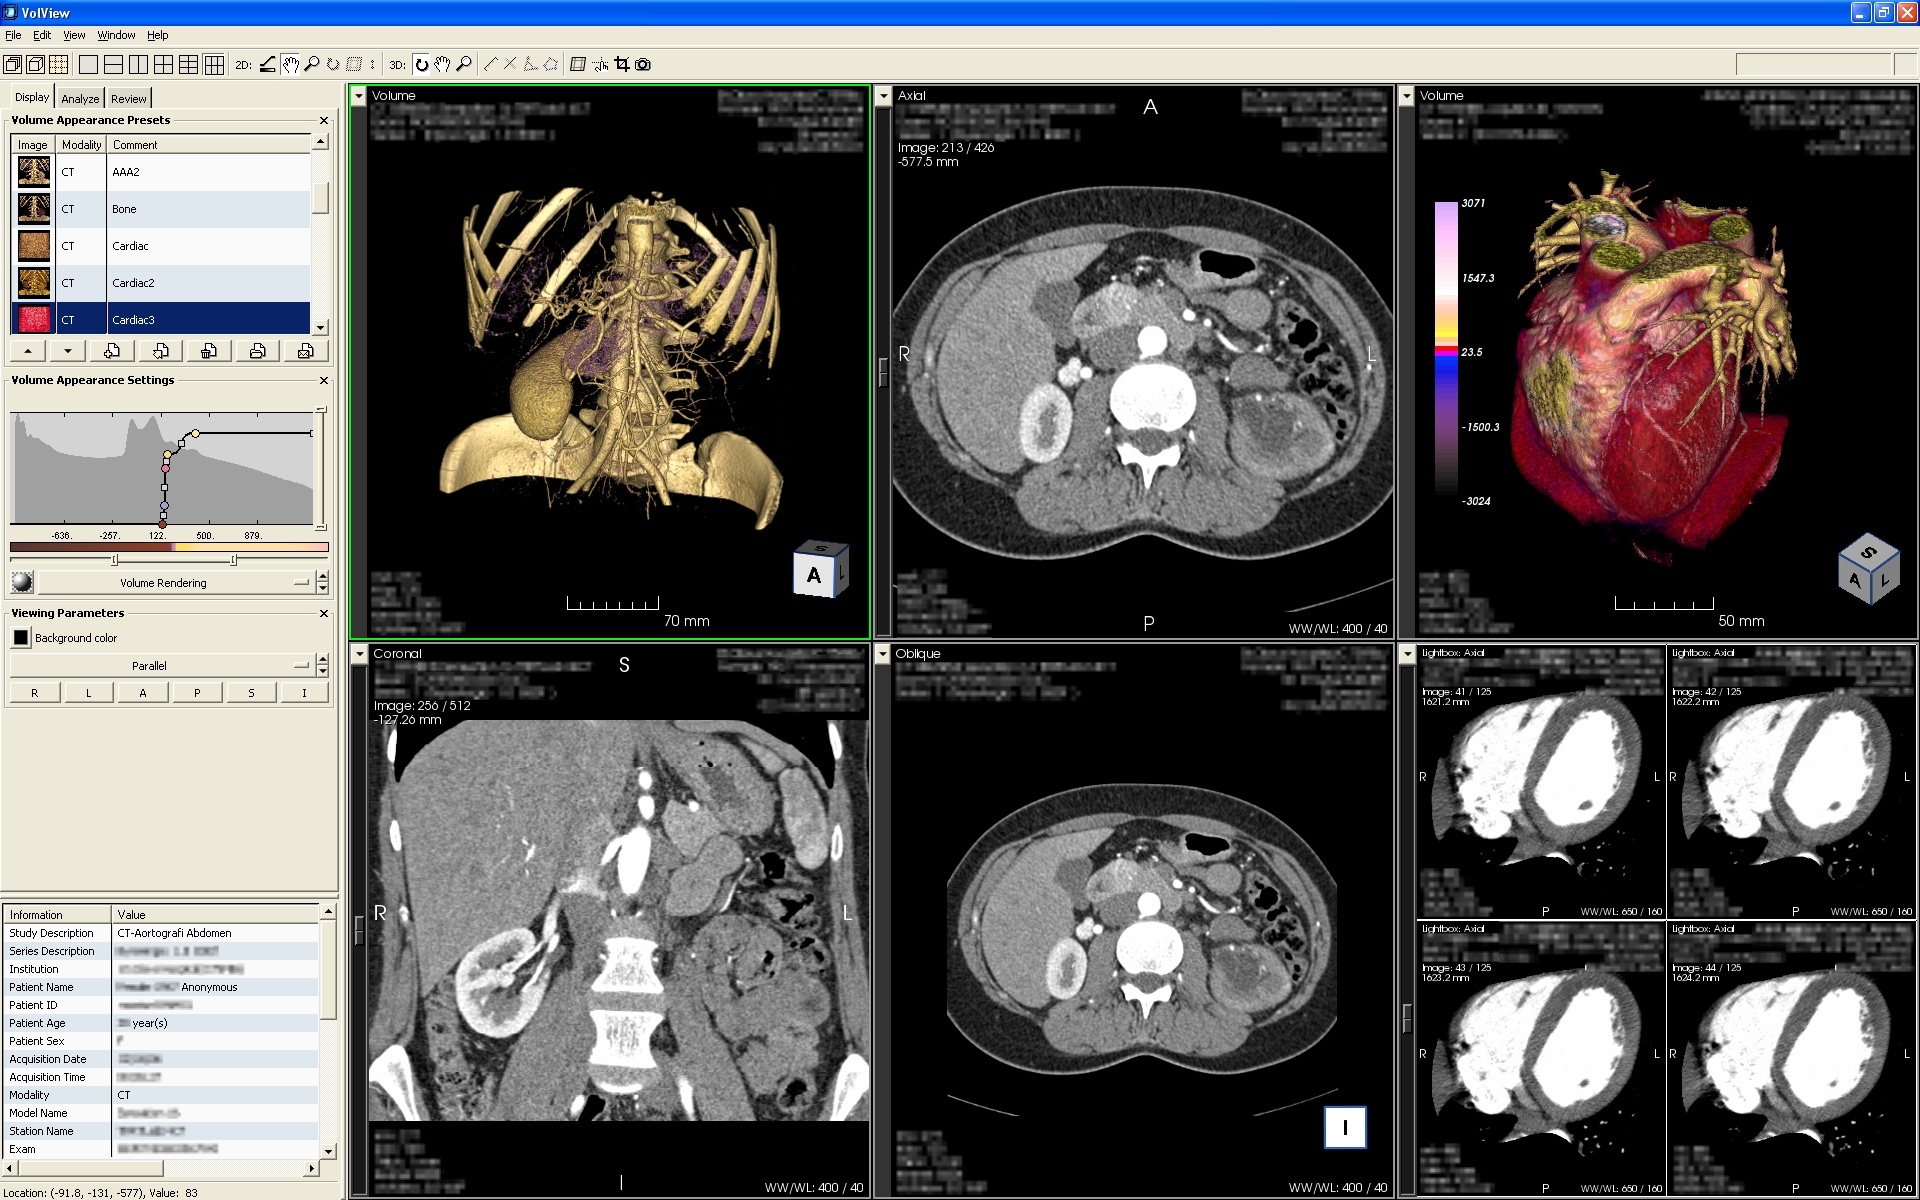
full_VVC30_CTA_Kidney_Cardiac 05_03_06
Volume rendering and CT display of a human torso, with emphasis on the kidney.
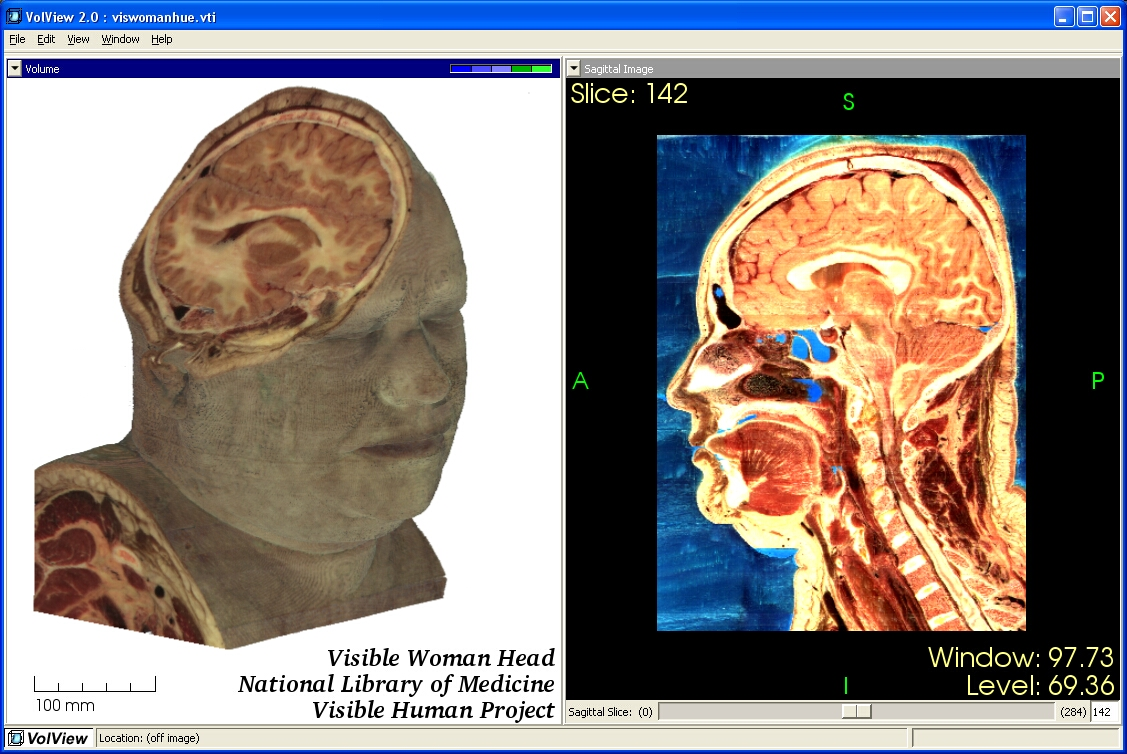
full_VolViewVW
Volume rendering and image display from the visible woman dataset.
full_VisibleWoman
Volume rendering and image display from the visible woman dataset.
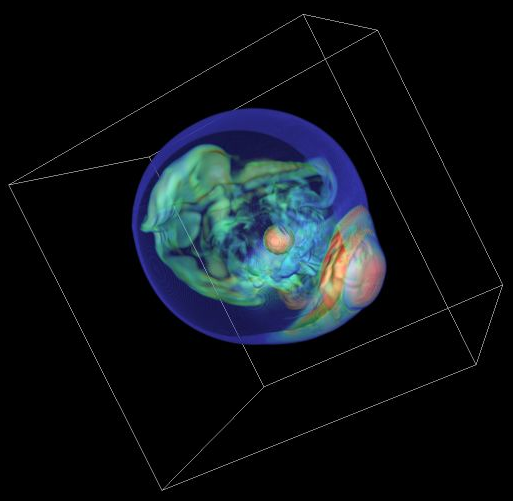
full_supernova
Volume rendering of a supernova delineating the rapid, unsaturated, nonlinear growth of a long-wavelength, (l=1,2 mode instability) which may have ramifications for the supernova mechanism, energetics, and dynamics and phenomenology. Dataset Courtesy of the Terascale Supernova Initiative (TSI)
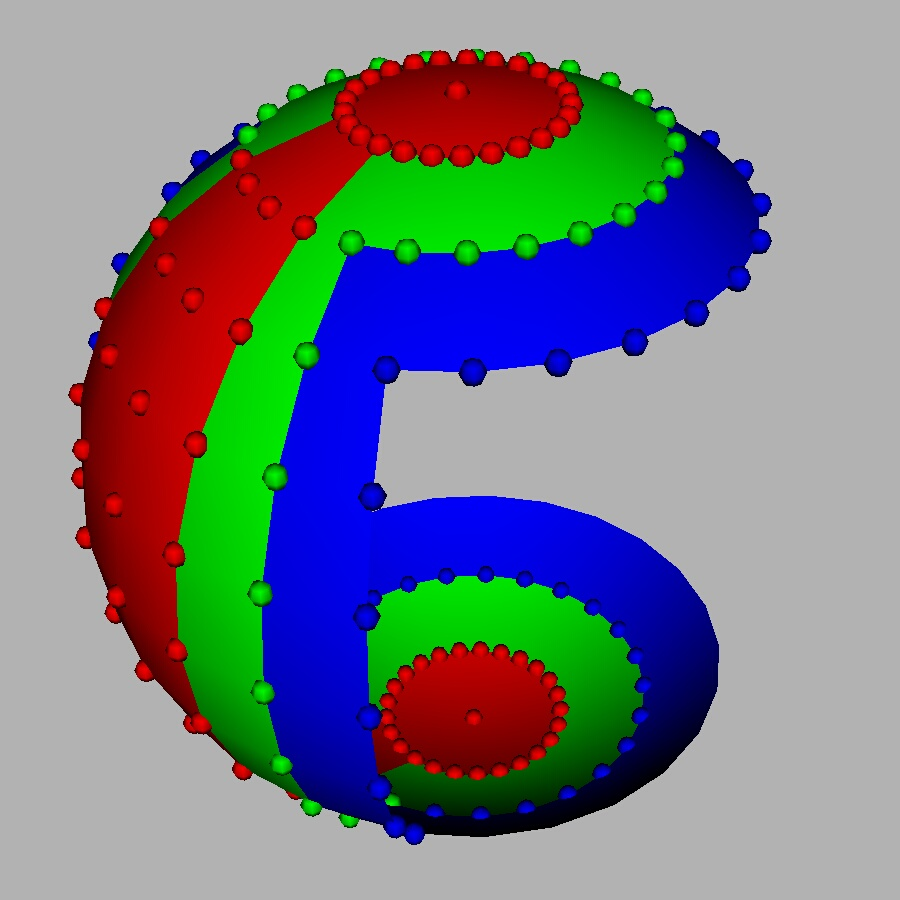
full_SphereInPieces
Processing a dataset in parallel. The different colors indicate on which processor id the data was processed.
full_shuttle
Fluid flow around the space shuttle. Coloring of the data corresponds to flow density at that point.
full_plate52
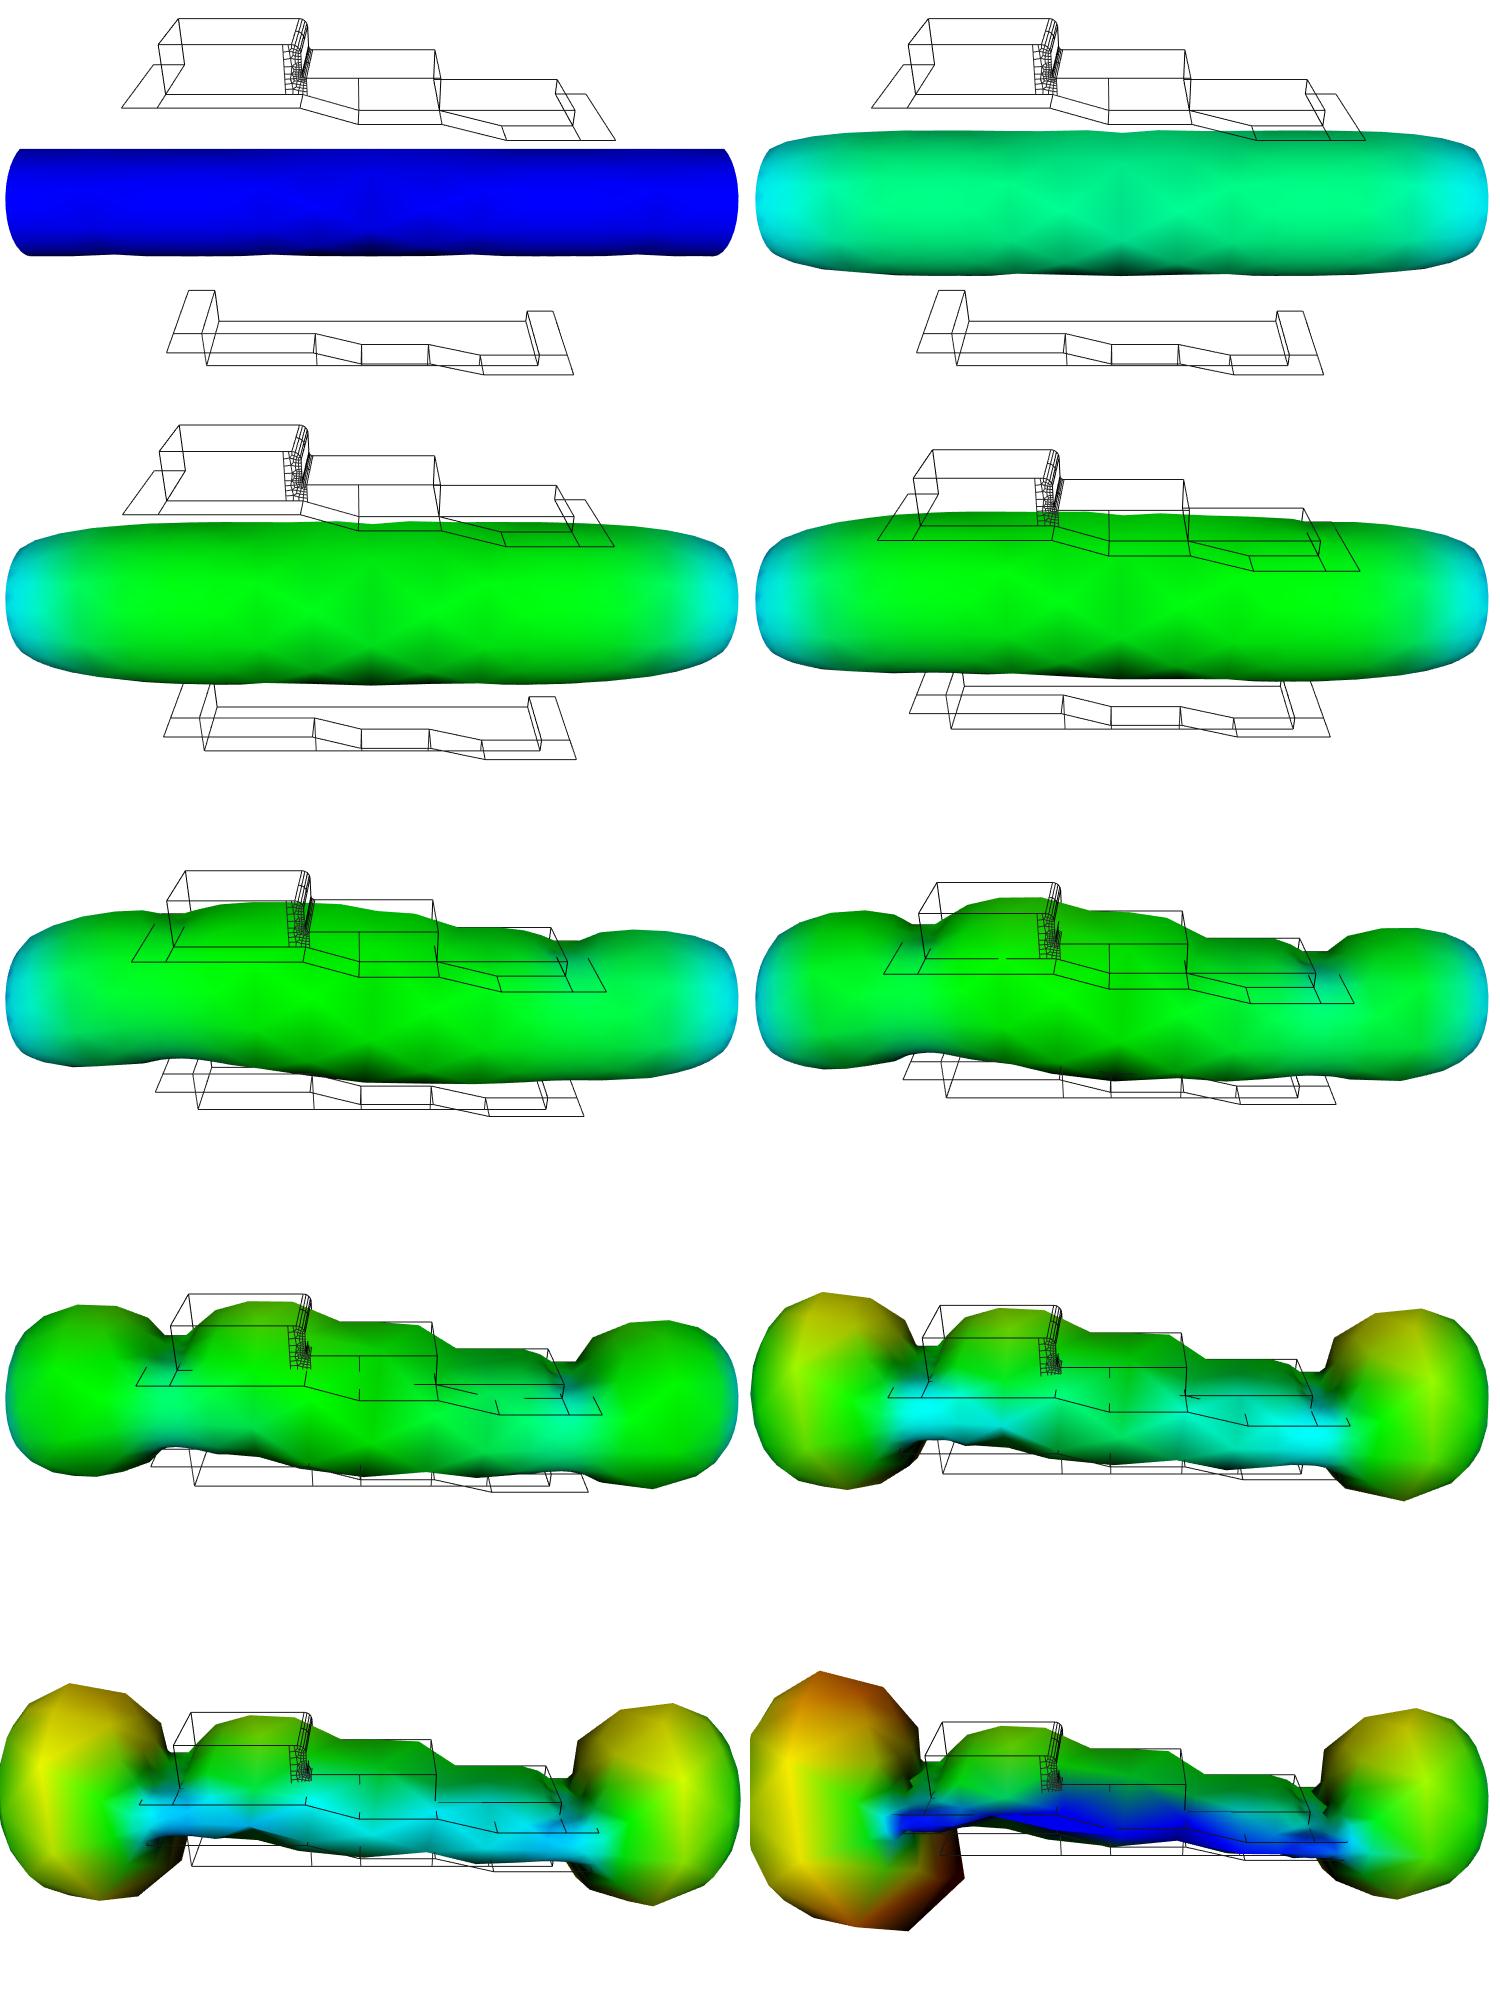
An animation of a plastic blow molding process. A hot balloon of plastic is shaped by moving molds at the same time the balloon is inflated.
full_plate50
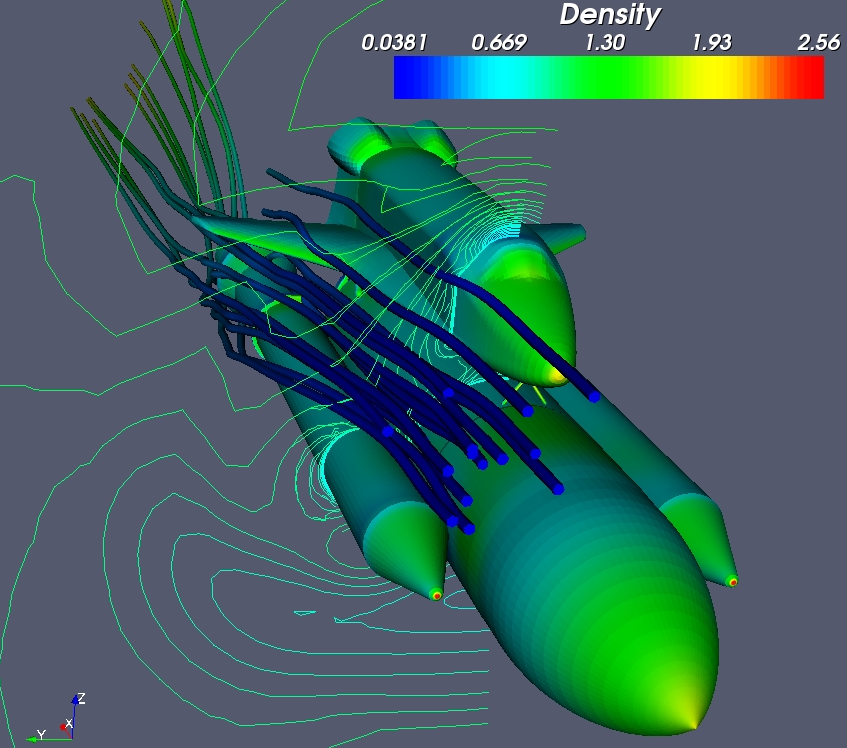
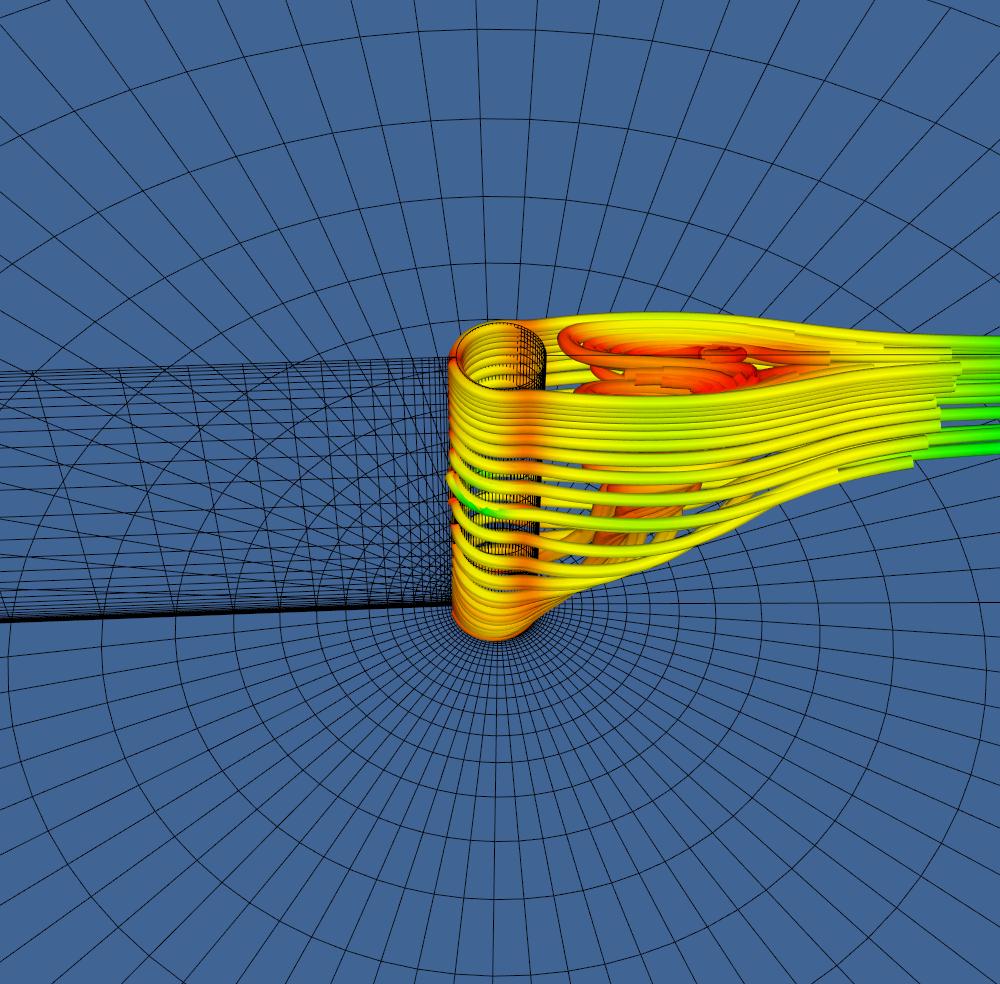
The flow of fluid (LOx) around a tube is described using streamtubes.
full_plate49
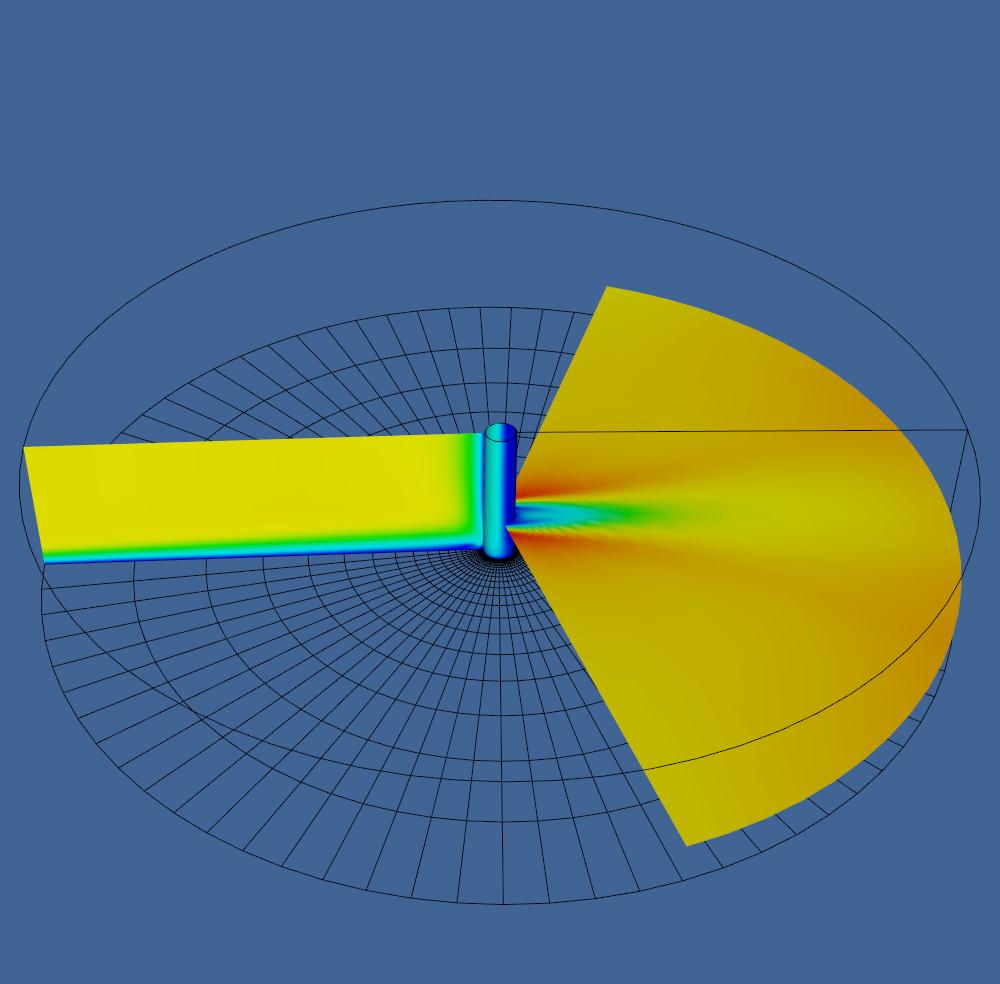
Data in the vicinity of fluid flow (LOx) around a tube.
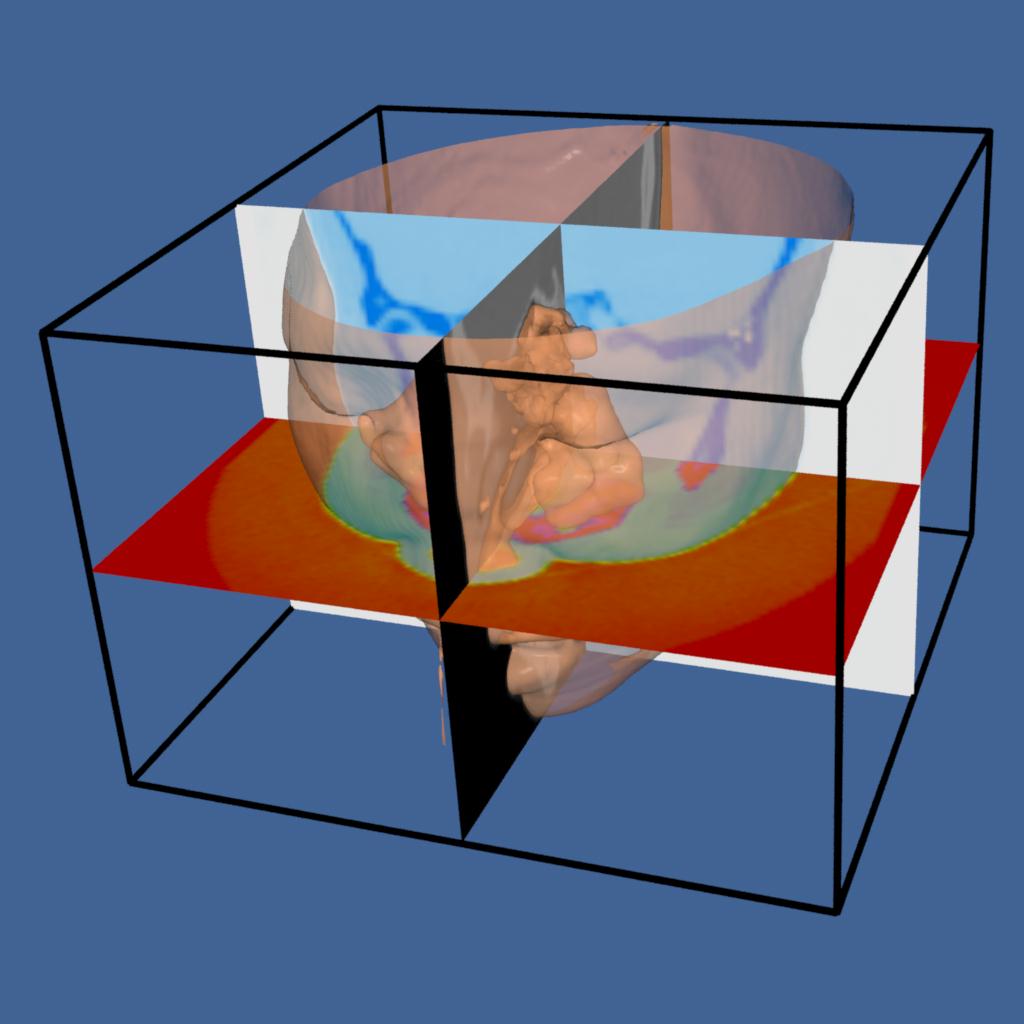
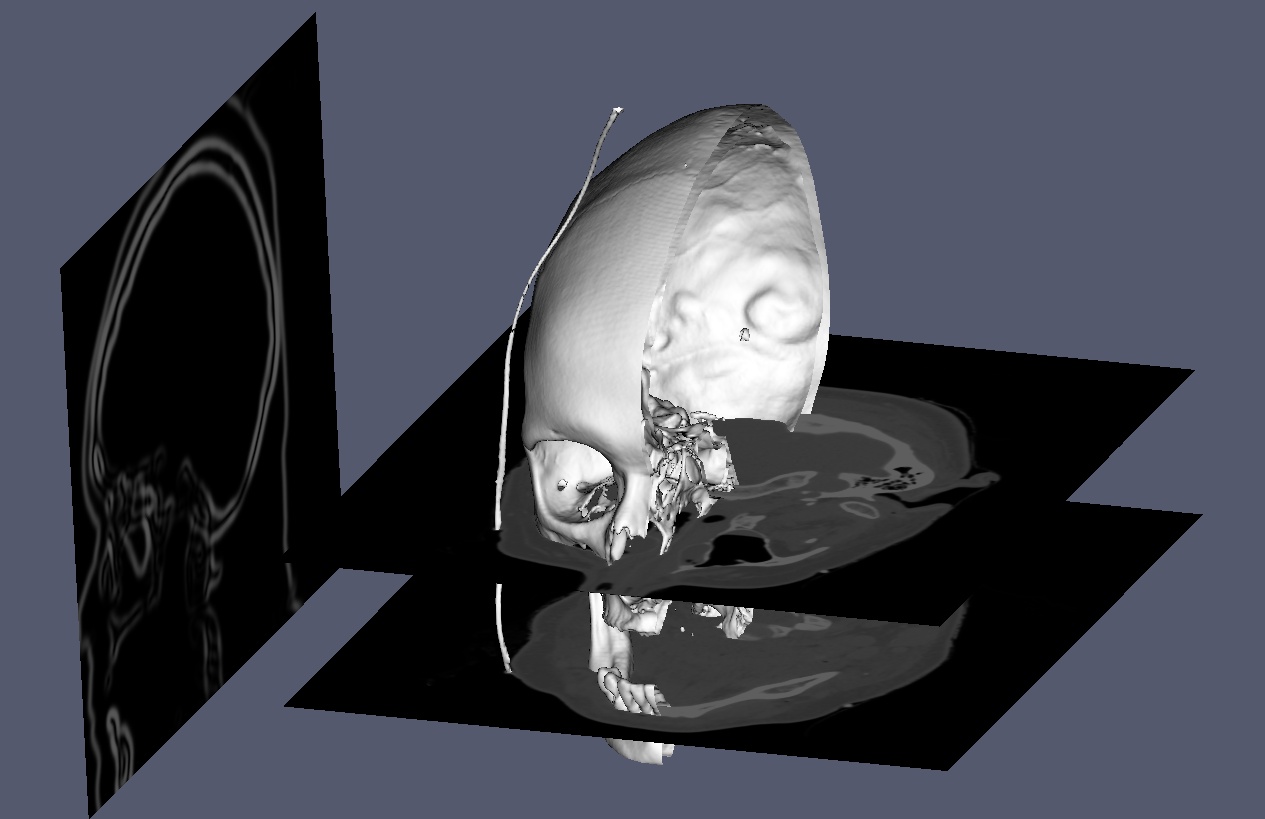
full_plate46
Visualizing a CT scan of the human head using an isosurface of the skin, and cross-sectional planes through the data.
full_plate41
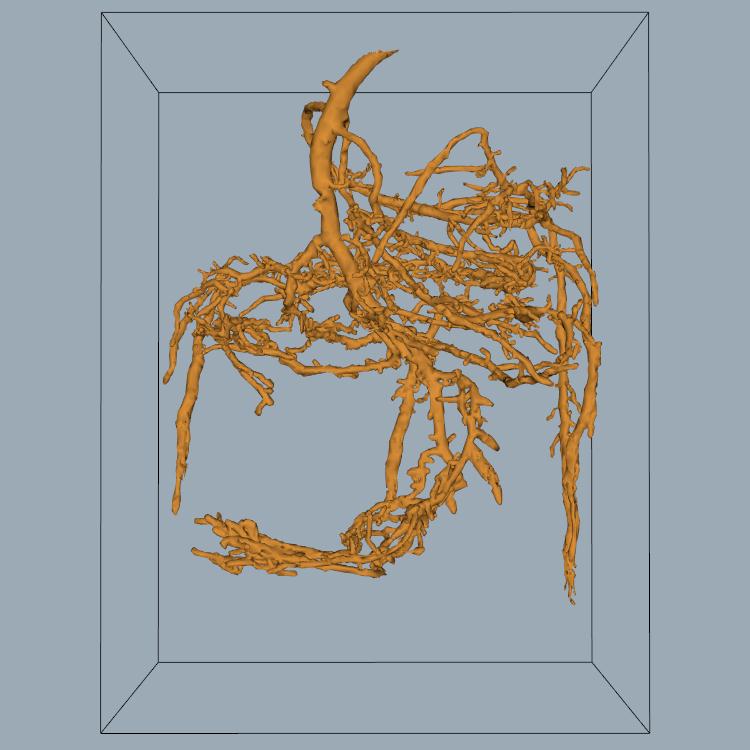
full_plate40bottom
An isosurface of a pine root from an MRI image sequence.
full_plate39
Visualization the combustion process in a segment of an annular combustor. The combustor is where fuel and air is burned in a gas turbine.
full_plate34
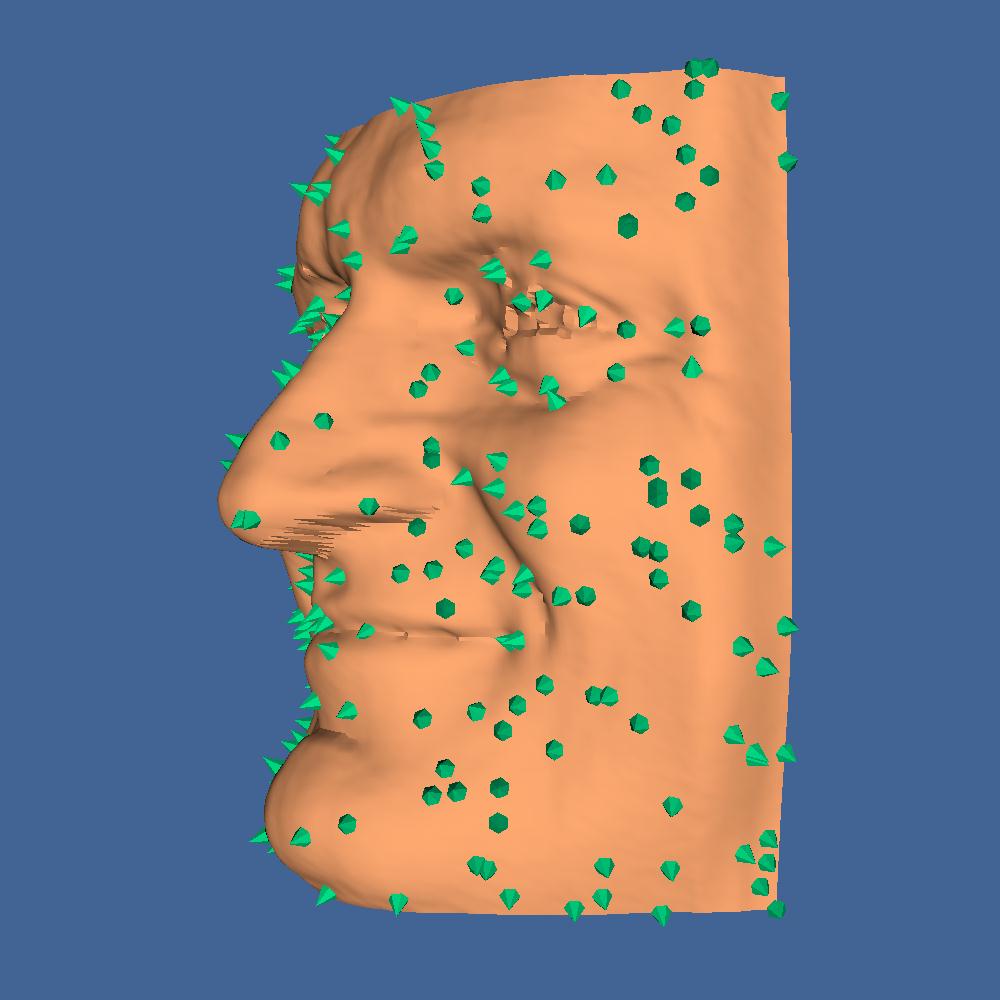
Glyphing a polygonal model of a human face to indicate the direction of surface normals.
full_plate31
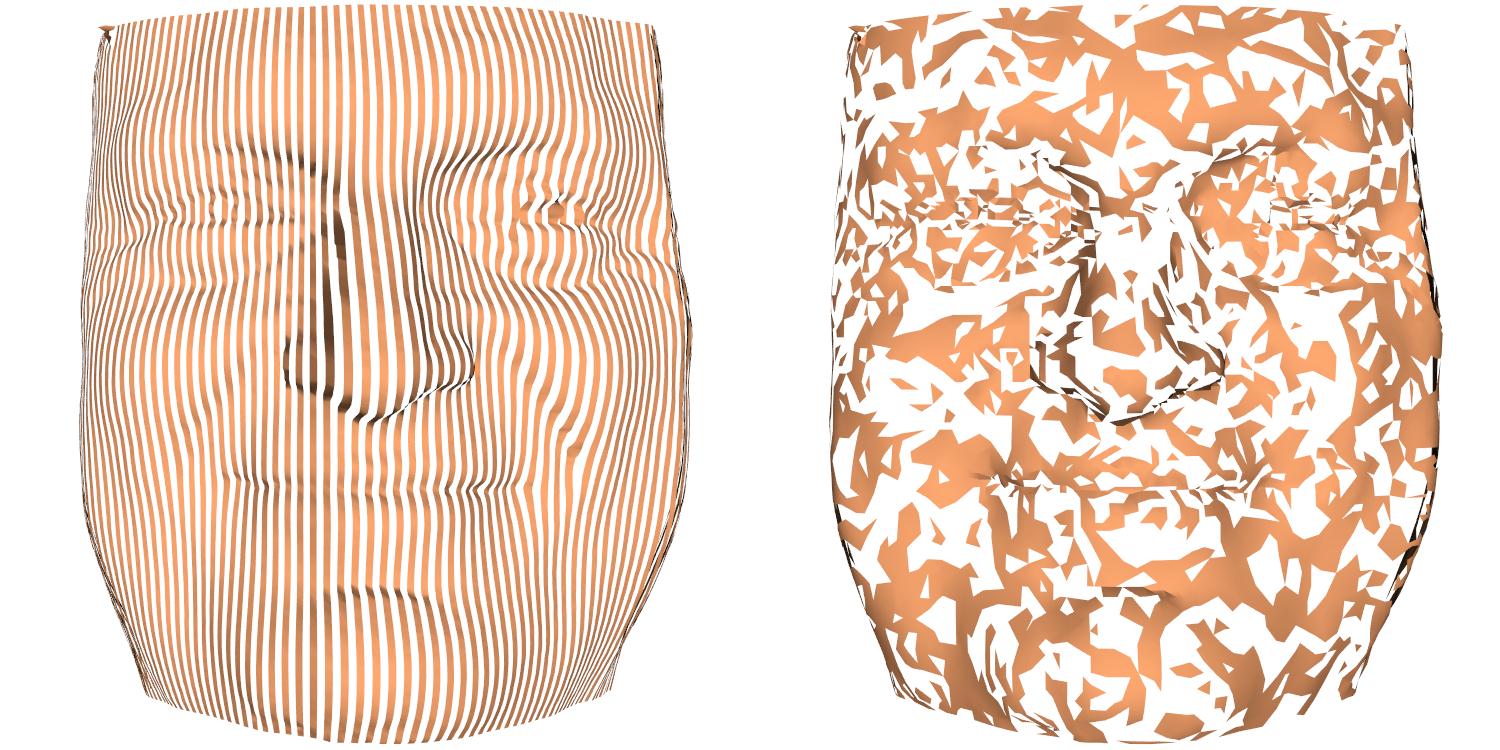
Generating triangle strips from a polygonal data set. On the left, the original laser range data is stripped; on the right, an unstructured mesh (after decimation) is stripped.

full_plate30
A model of an aircraft engine fuel/oil heat exchanger.
full_plate24
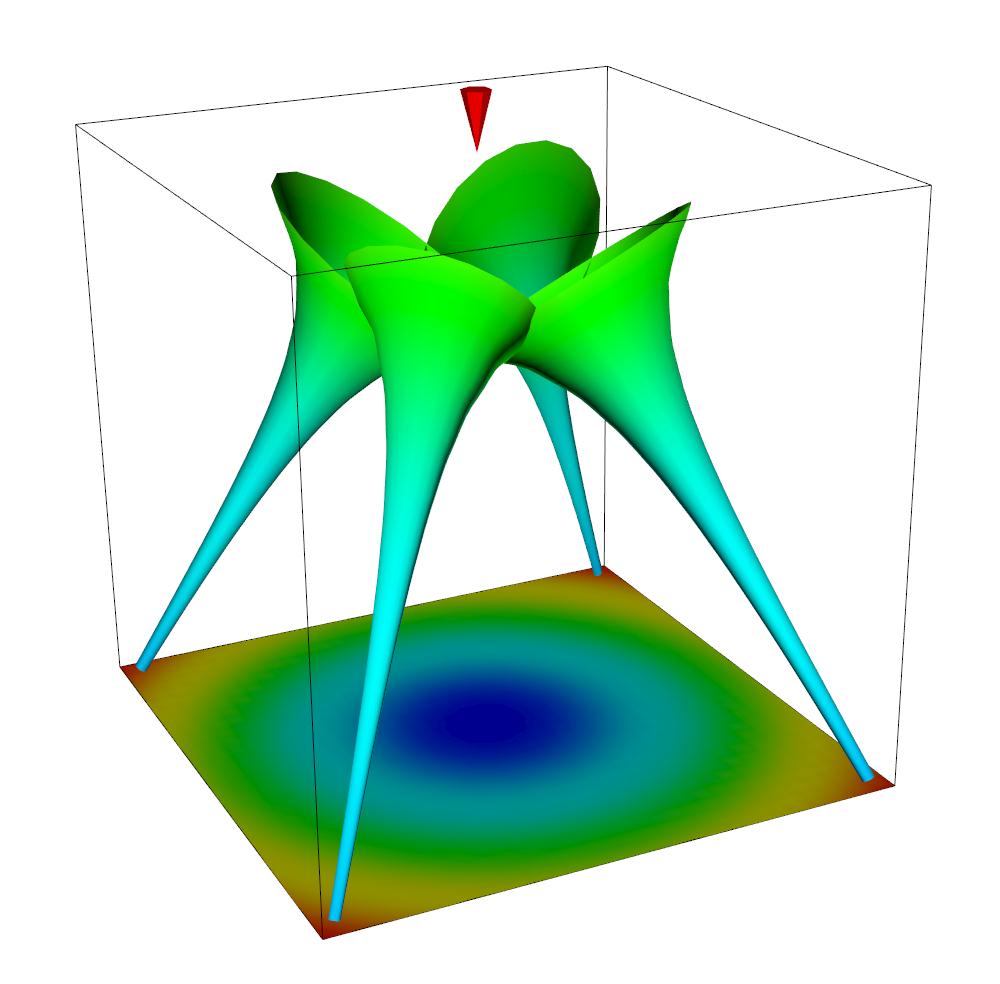
Hyperstreamlines in a semi-infinite domain approach a load singularity (the application of the load is marked by a small red cone).
full_plate23
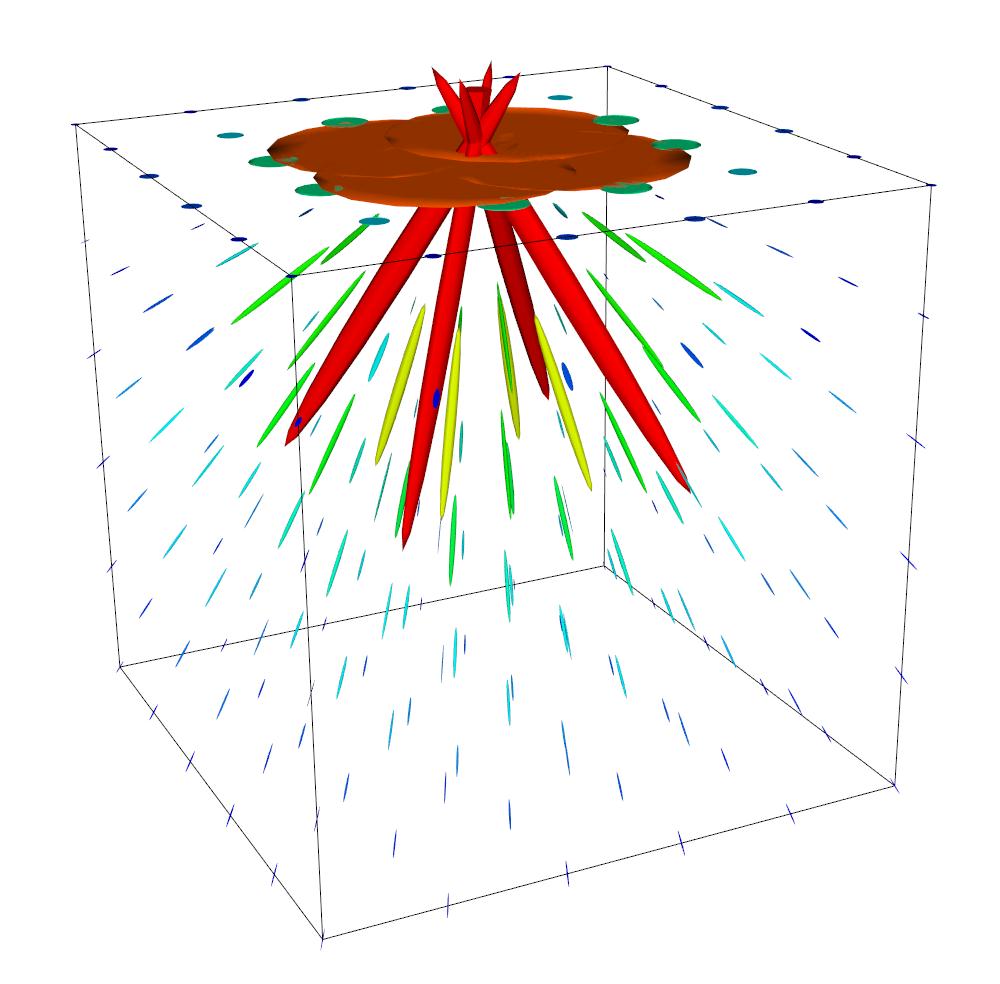
Tensor ellipsoids in a semi-infinite domain approach a load singularity (the application of the load is marked by a small red cone).
full_plate20
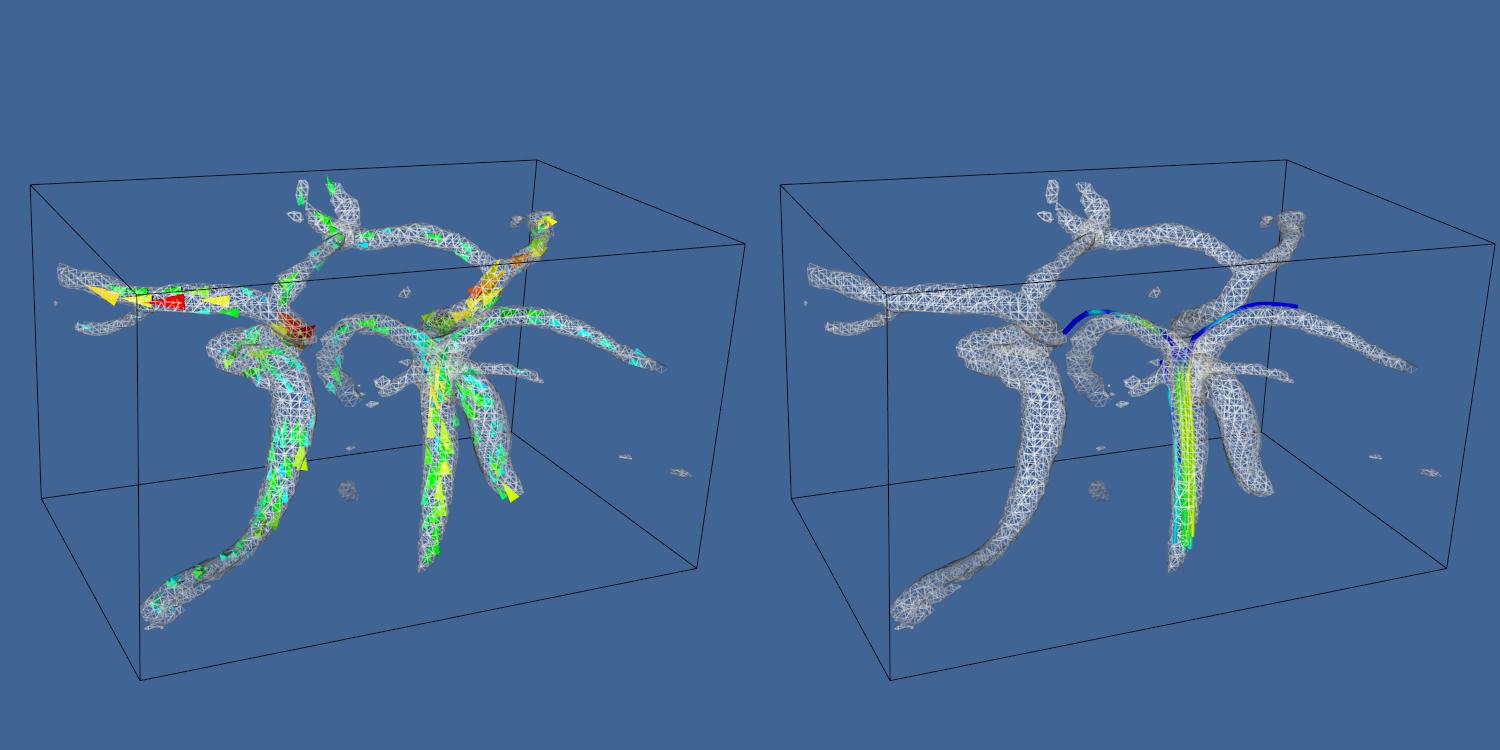
The visualization of fluid flow in human vasculature.
full_plate13
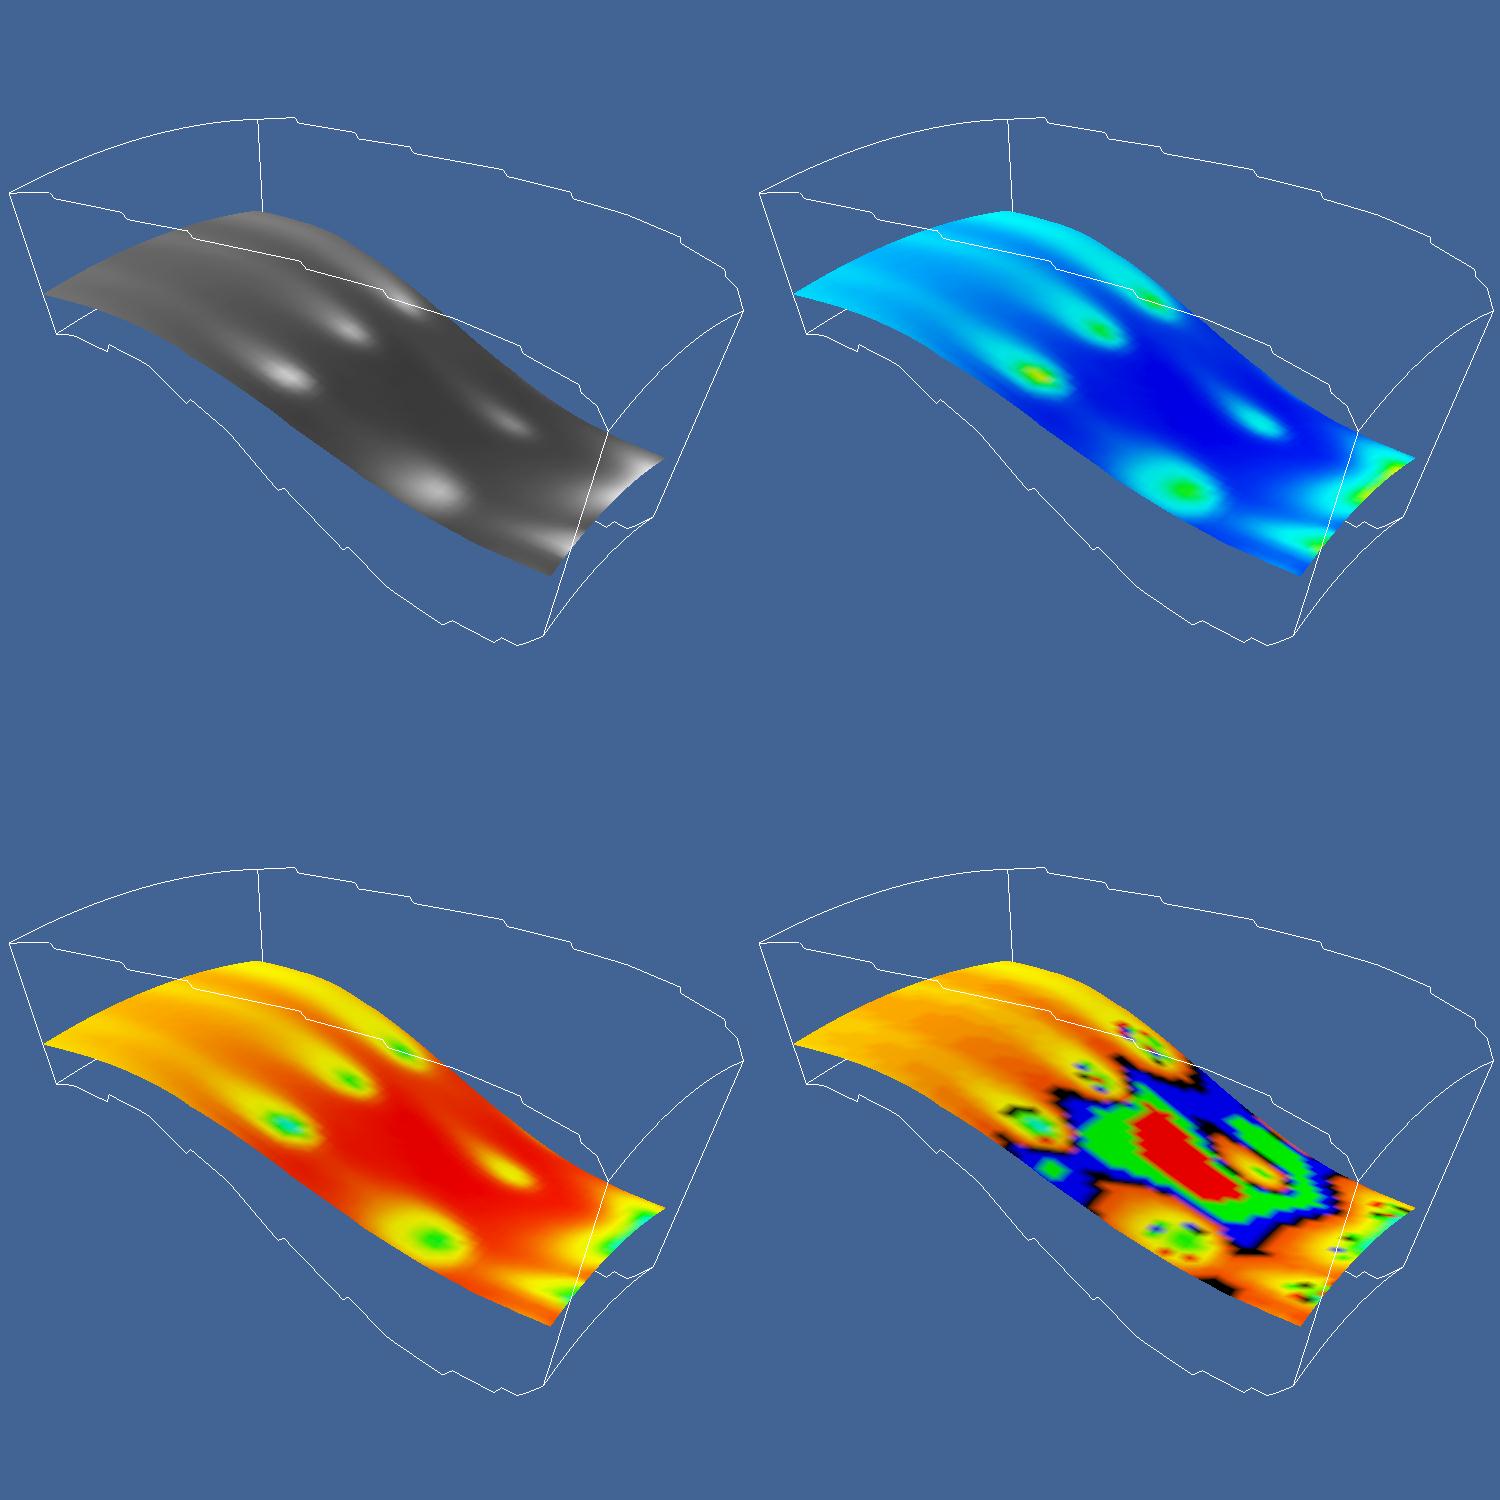
Visualization the combustion process in a segment of an annular combustor. The combustor is where fuel and air is burned in a gas turbine. Different lookup tables are used to highlight different parts of the data.
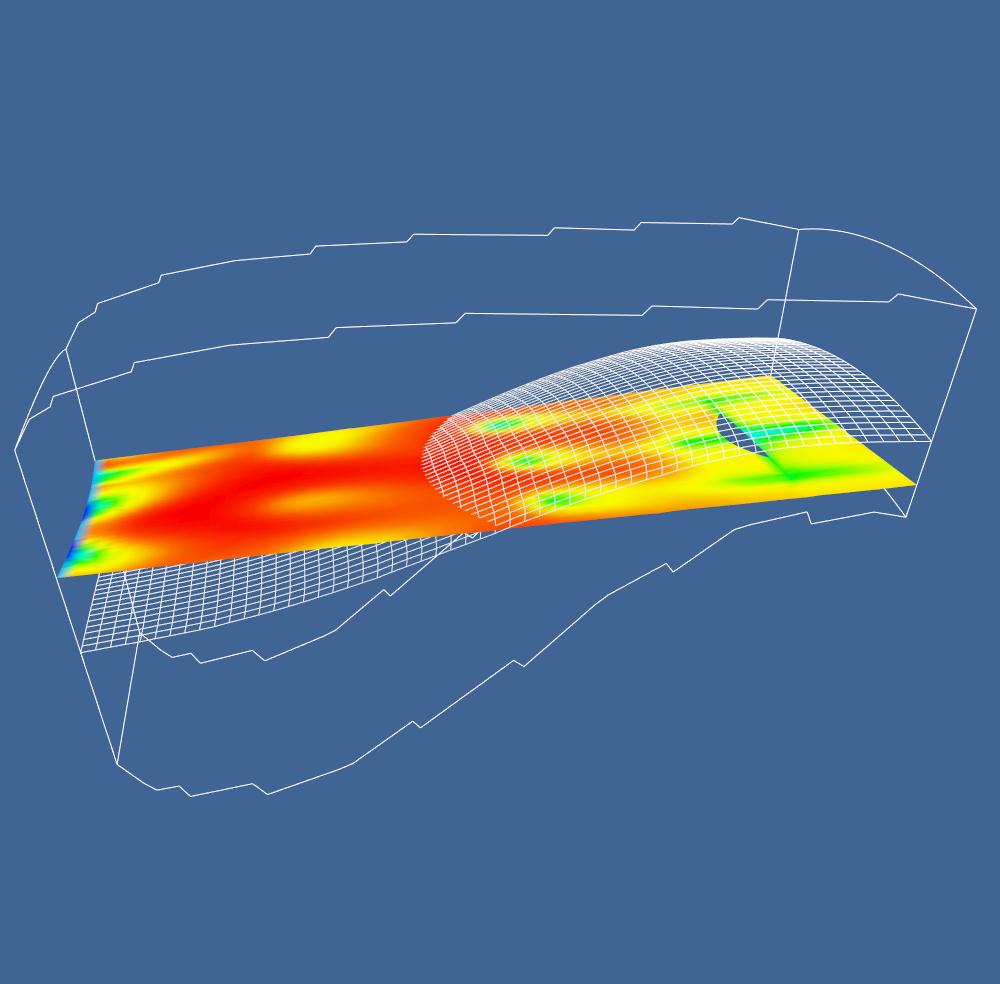
full_plate12
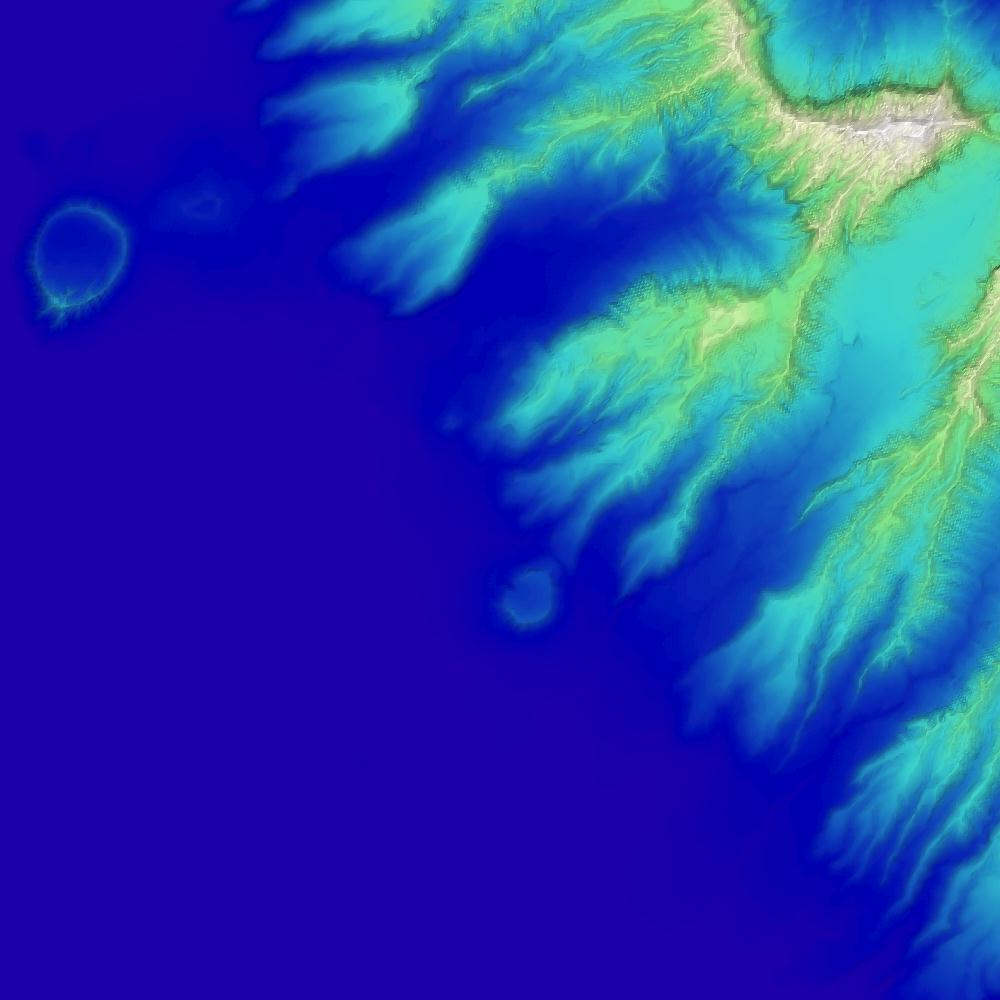
Visualizing terrain using a color map based on height.
full_ParaViewDeltaWing
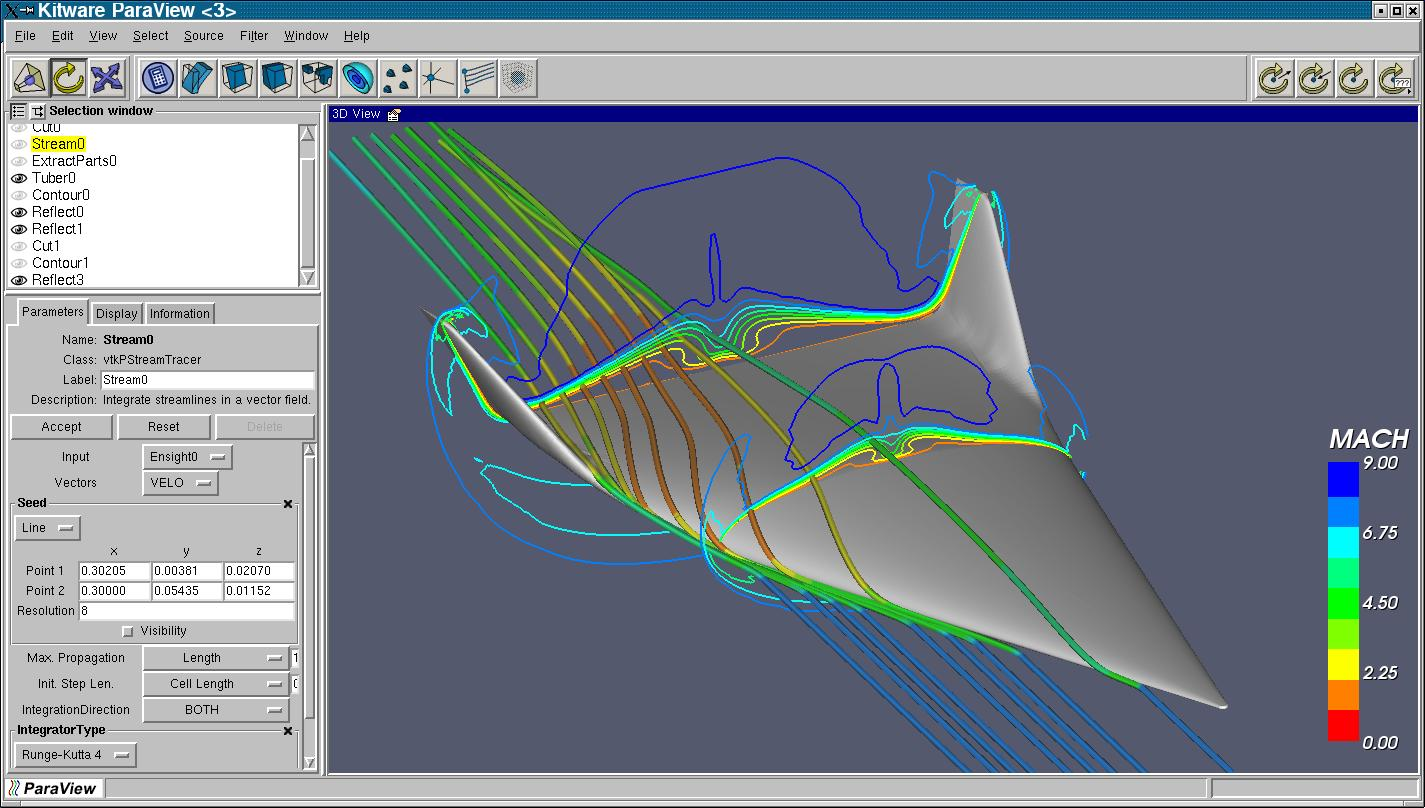
Airflow over a delta aircraft is visualized using streamlines.
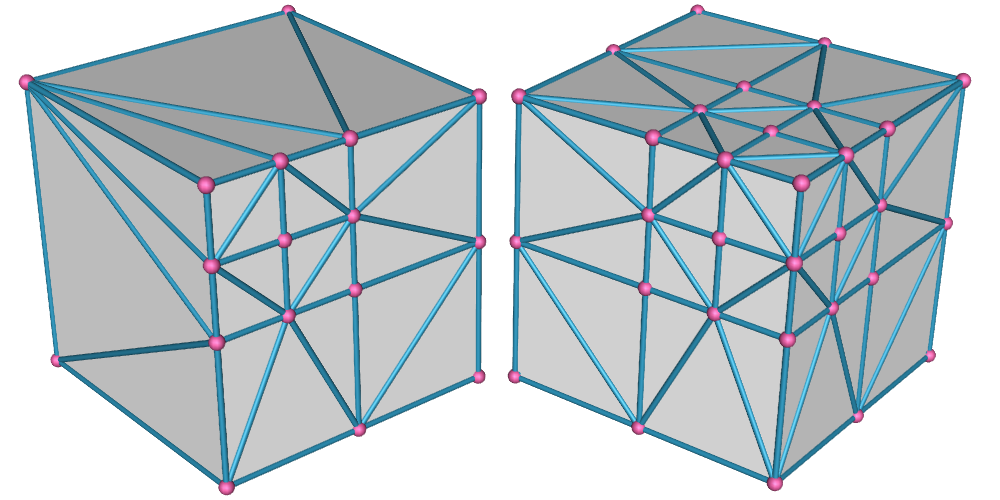
full_OrderedTriangulation
Meshing neighboring octants in an octree using the ordered triangulator. To create consistent meshes, the diagonals of the mesh must be chosen consistently across element boundaries.
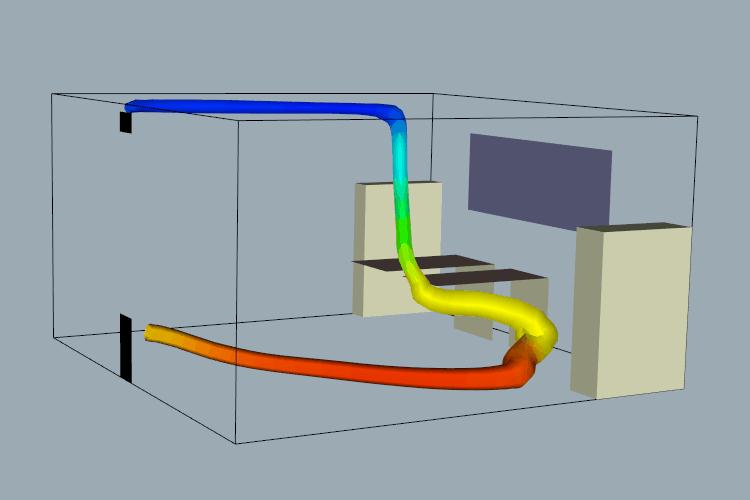
full_officeTube
Visualizing fluid flow in an office using a stream tube. The colors indicate temperature. The tube runs from the room intake to its exhaust duct.
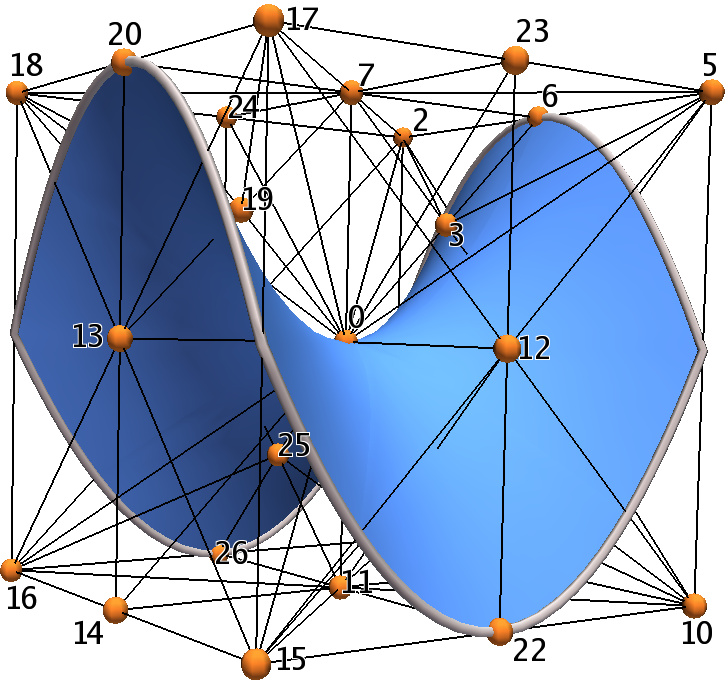
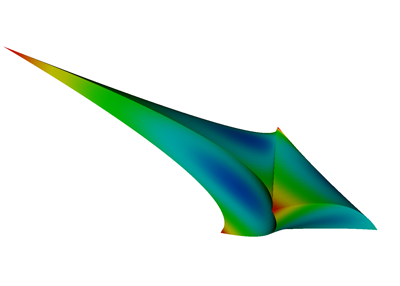
full_LagrangeShape
Using VTK to visualize a NURBS surface. Author: David Thompson and Phillipe Pebay, Sandia
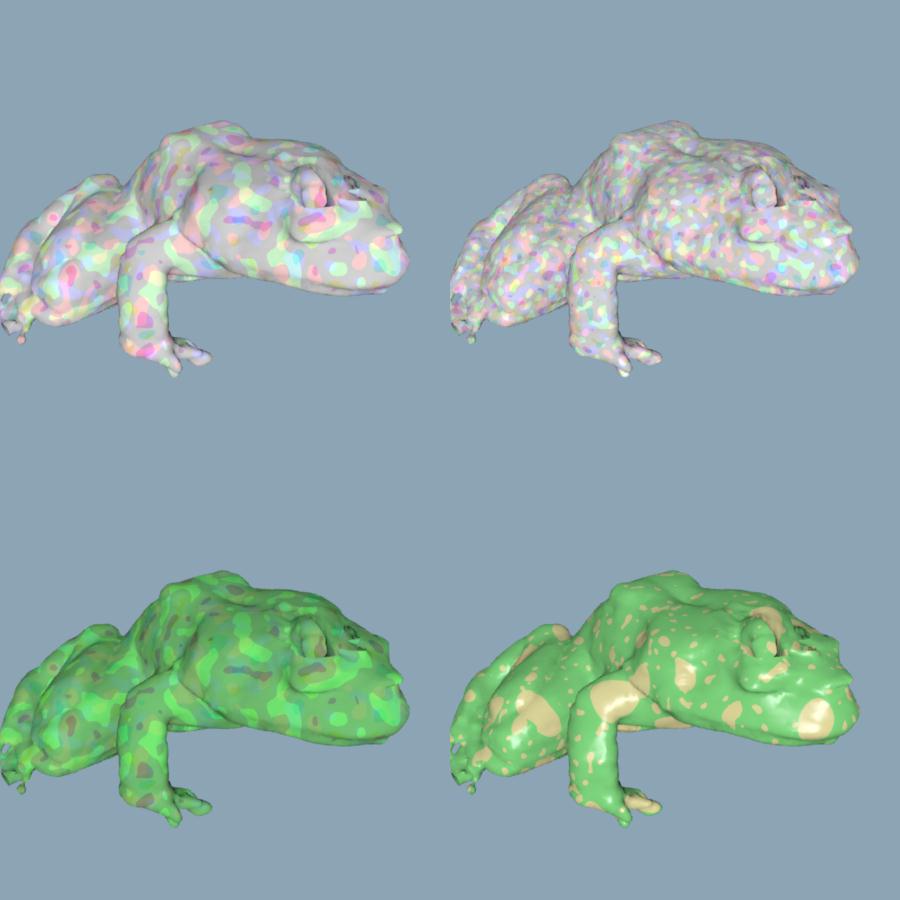
full_frog
Various rendering techniques applied to an MRI frog dataset.
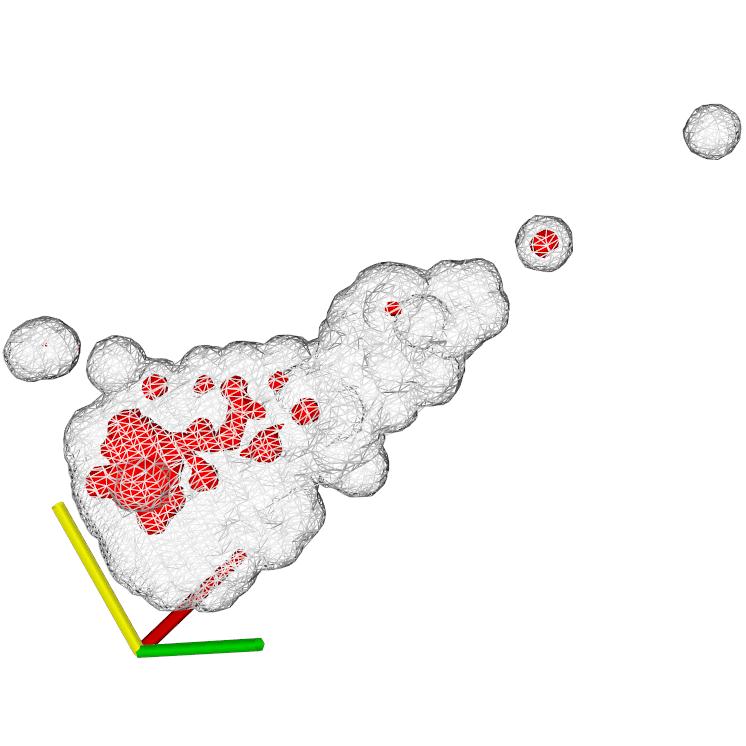
full_finance
Gaussian splatting followed by isocontouring used to visualize a loan portfolio. The red surfaces indicate delinquent loans.
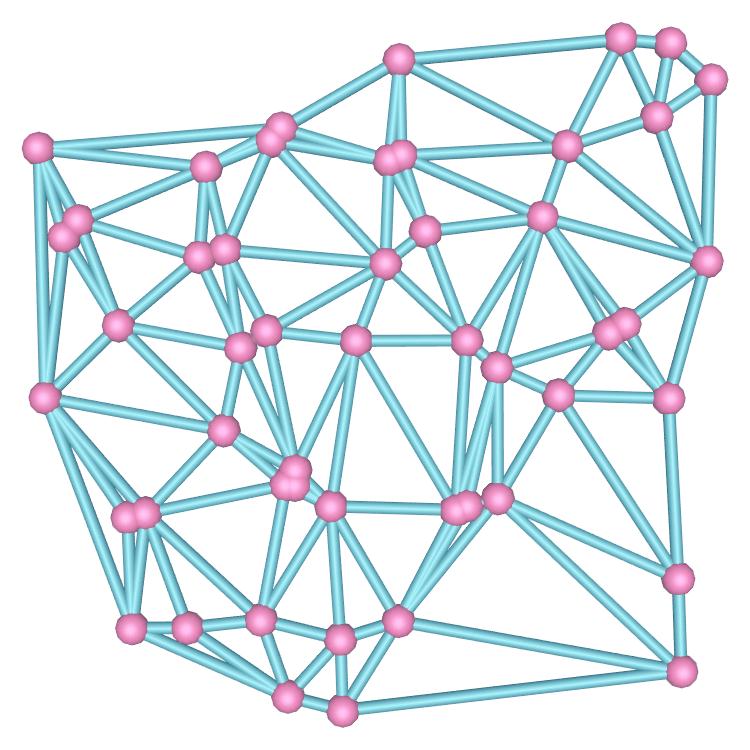
full_DelMesh
A 2D Delaunay triangulation of a random set of points.
full_CrazyTetras
Tessellation of a higher-order basis function. VTK supports an adapter framework enabling it to visualize arbitrary complexity element basis functions.
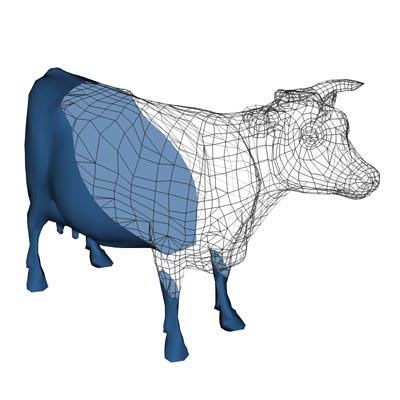
full_capcownewWhite
Clipping and capping a polygonal model of a cow.
full_BUTTERWORTHHIGHPASSF
VTK used to display a Butterworth High-Pass filter.
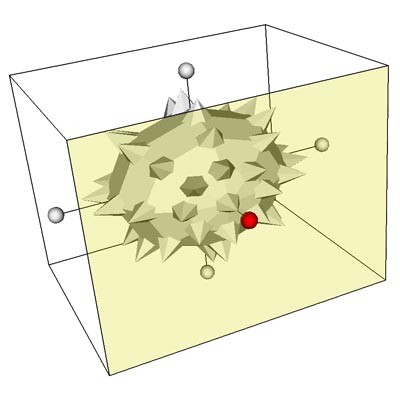
full_BoxWidget
A vtkBoxWidget is used to transform a geometric model. The box widget can be used to scale, translate, and rotate any object in VTK.
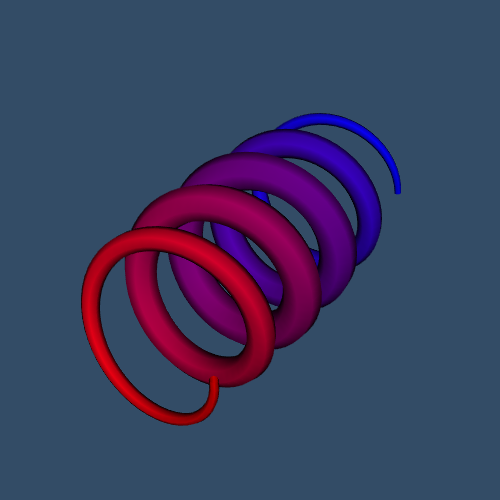
TestTubesWithVaryingRadiusAndColors
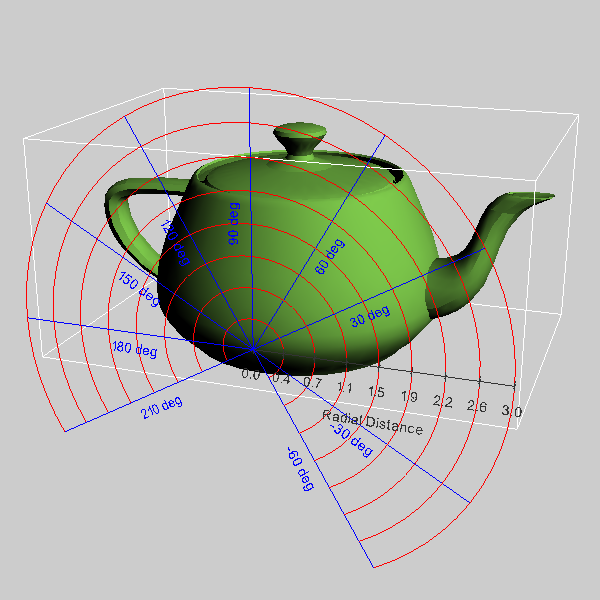
TestPolarAxes
eleState

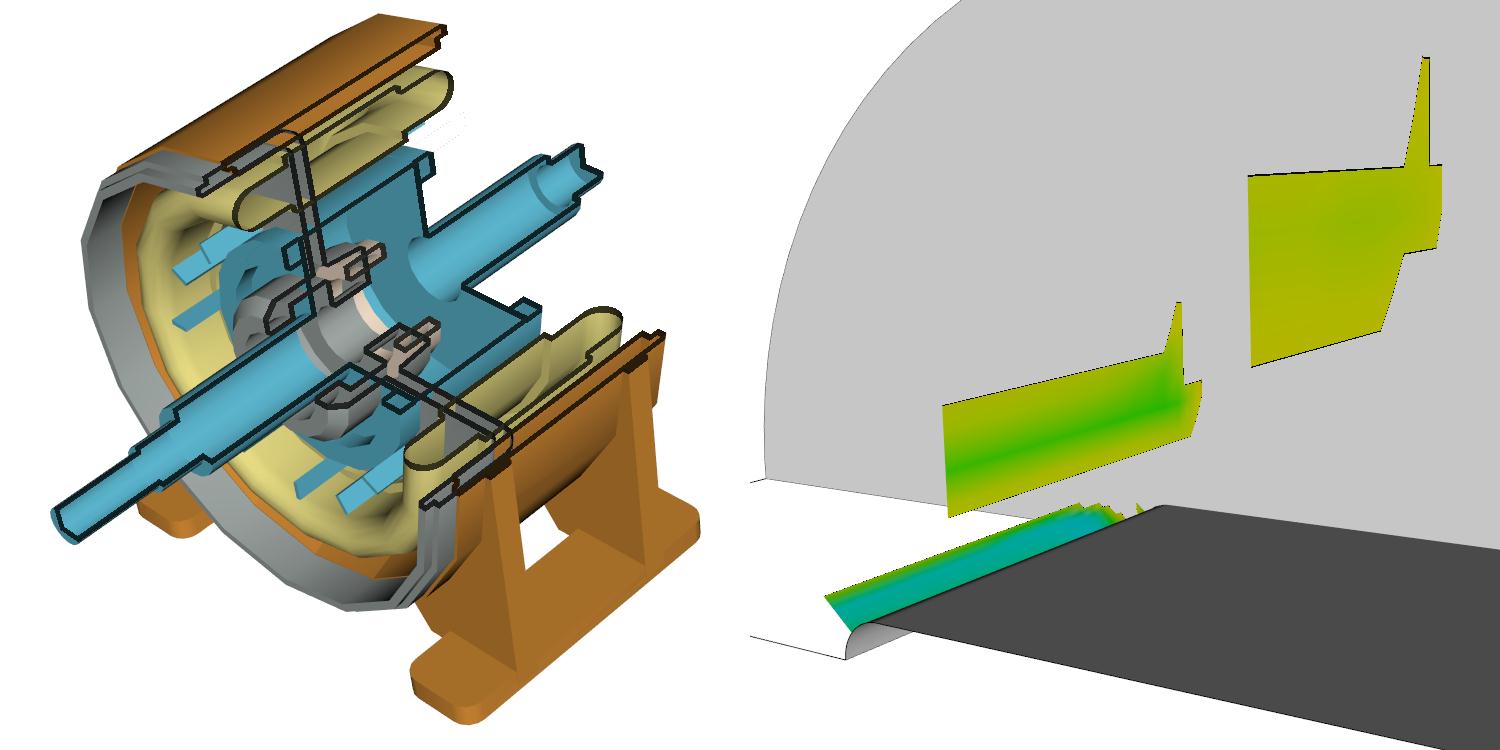
VoiceCoilComboSolution_150
Current and flux density in a voice coil assembly.
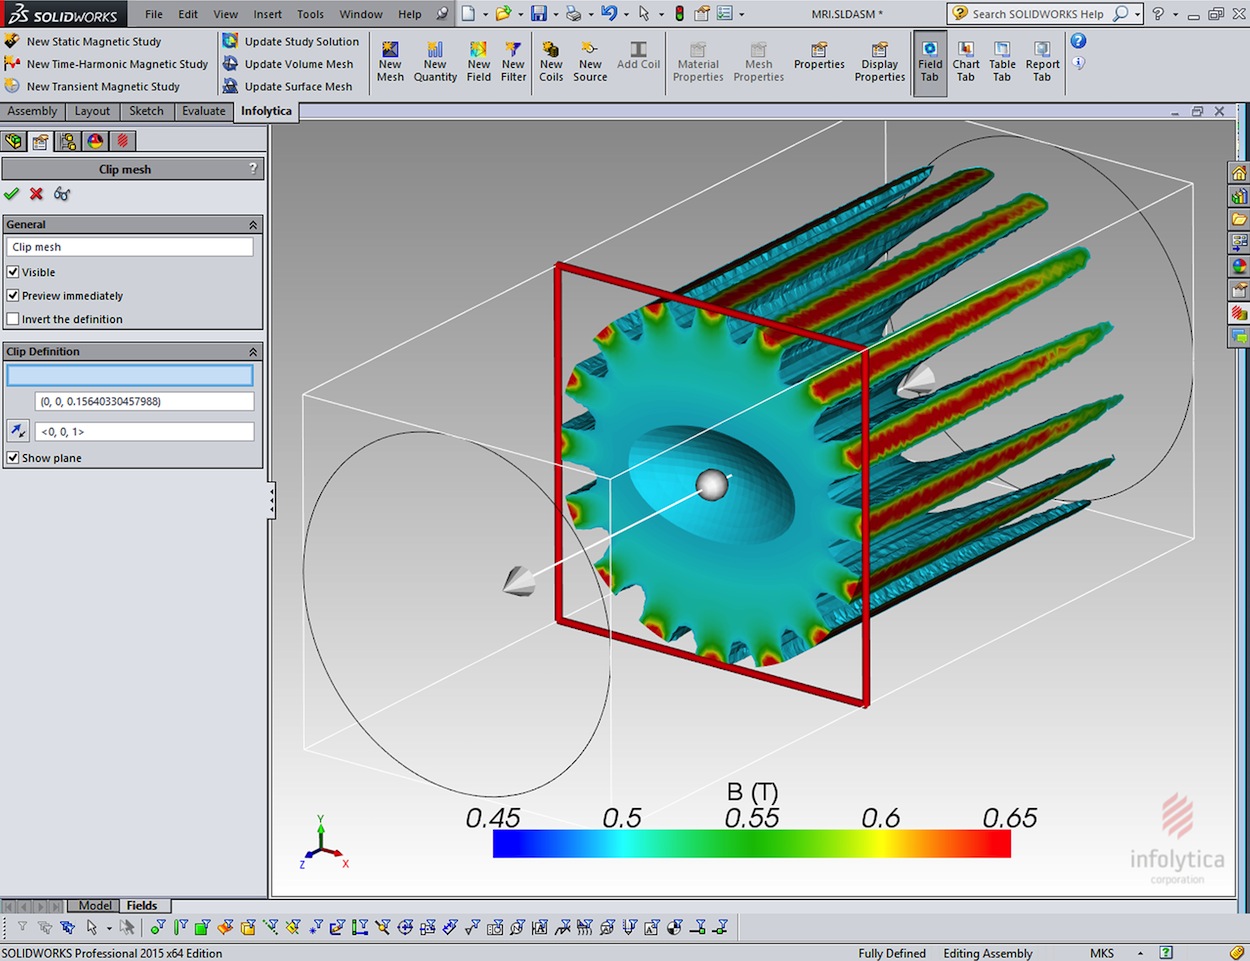
MRISolution_150
A clipped representation of the flux density in the bore of a MRI magnet assembly.
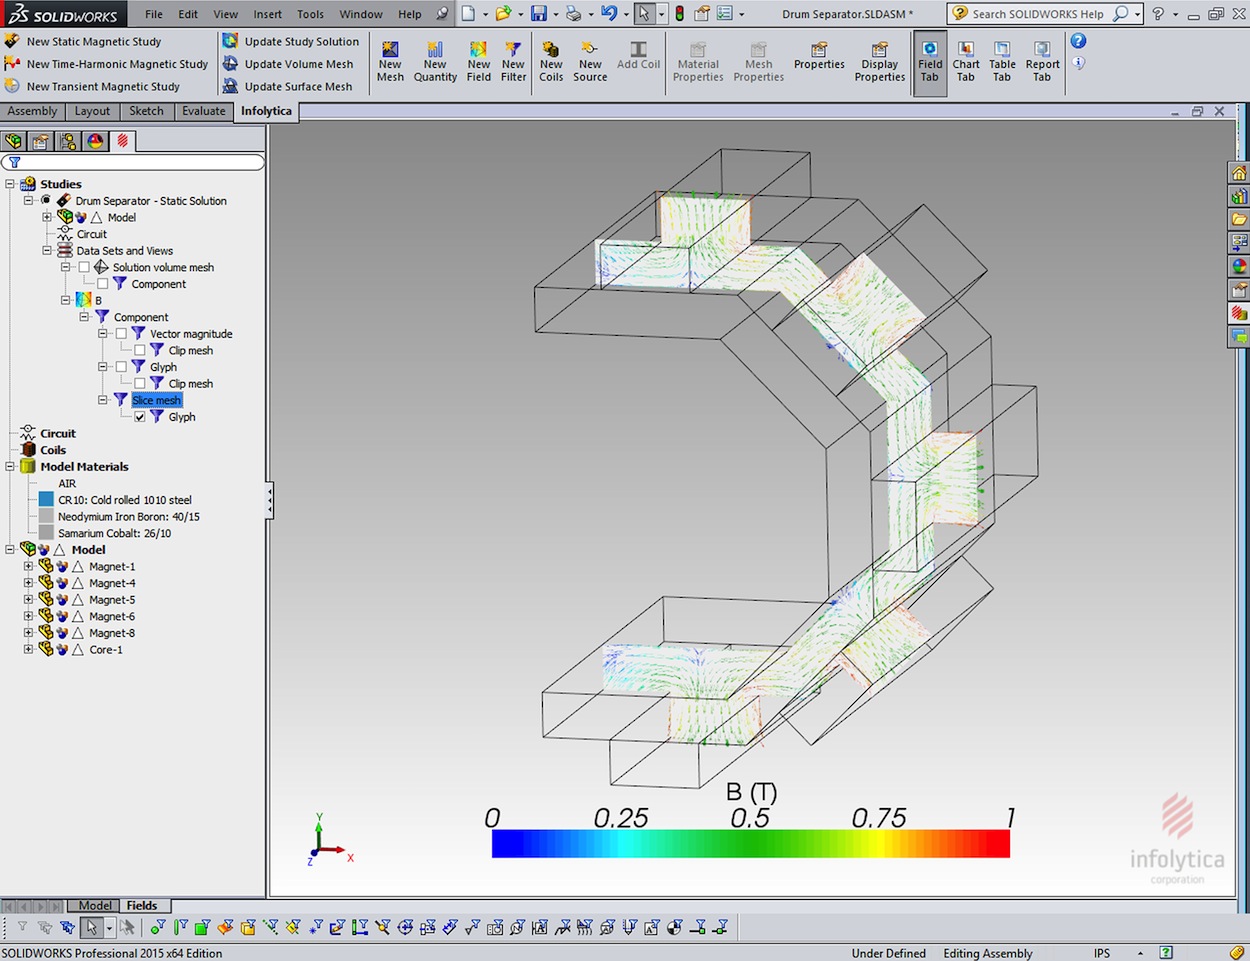
DrumSeparatorSolution3_150
A vector plot on a slice of magnetic field distribution in a drum separator.
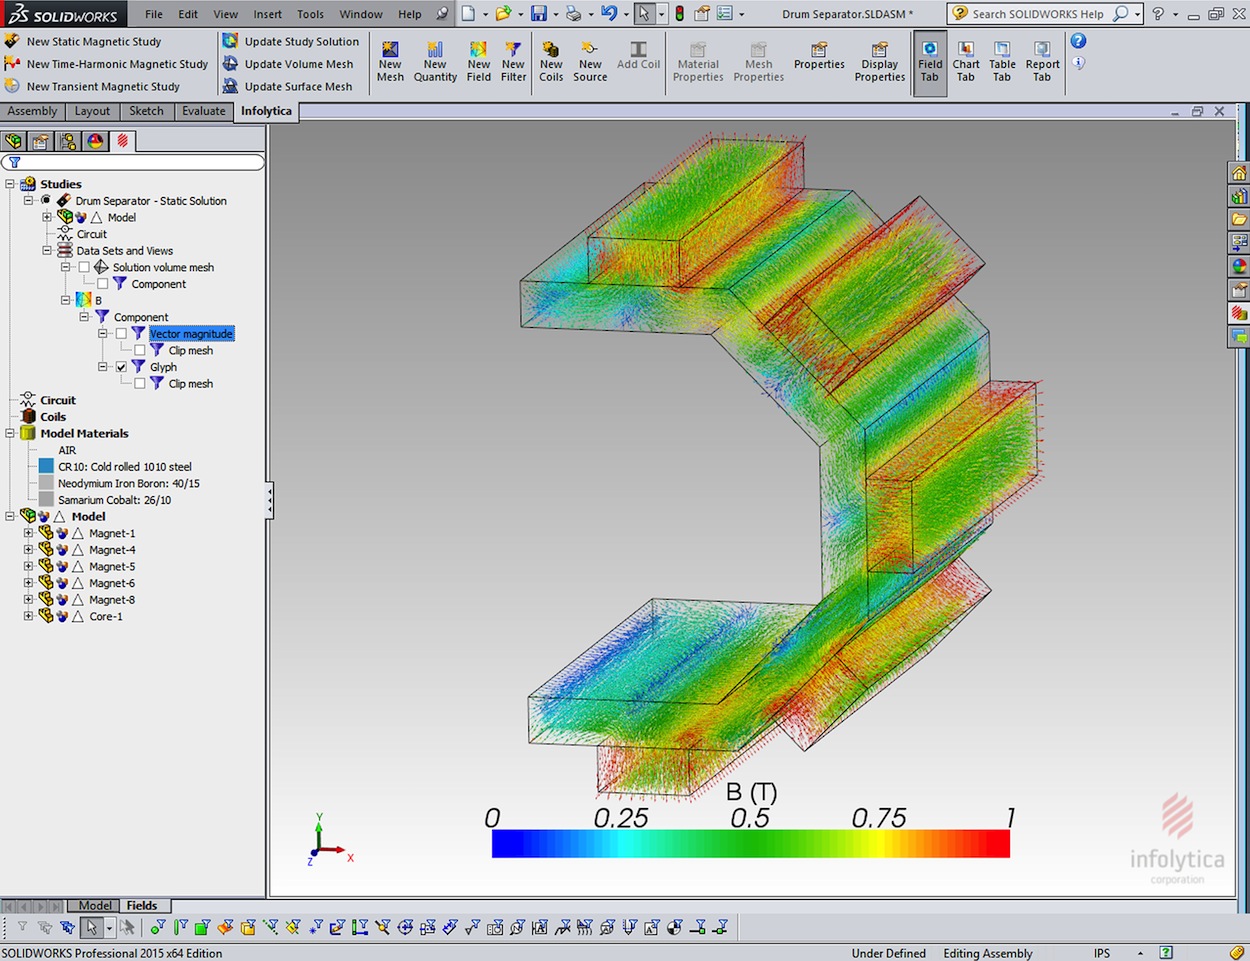
DrumSeparatorSolution1_150
A vector plot of the magnetic field distribution in a drum separator.
TestSplineWidget
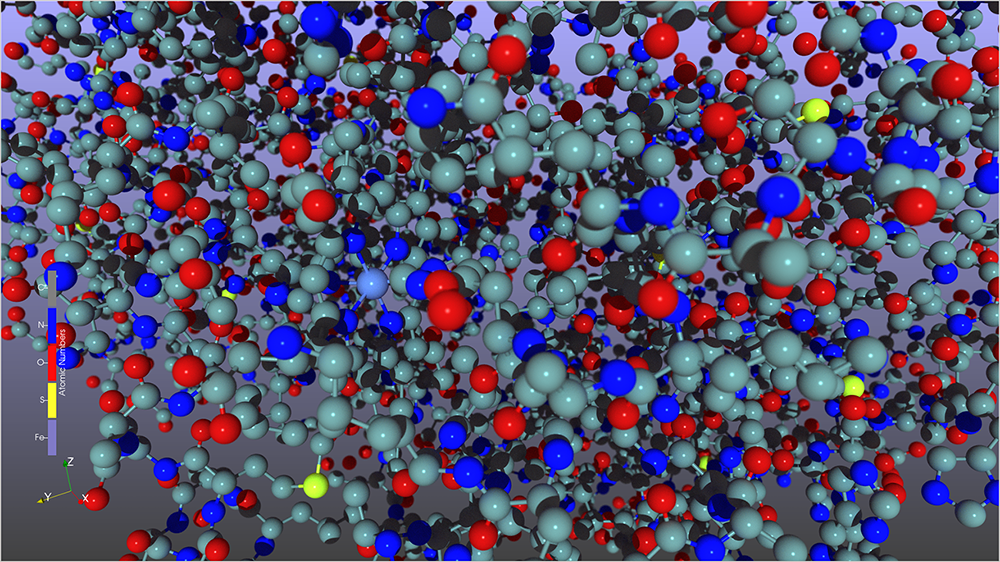
Display of a vtkMolecule
This image demonstrates display of a vtkMolecule, in which the rendering uses OSPRay path tracing with depth of field enabled.
Videos
VTK 7.0 Release Webinar
Date: February 3, 2015
Description: This webinar highlights the new features in VTK 7.0 and gives an overview of what’s coming in the next release.
VTK 6.0 Release Webinar
Date: June 12, 2013
Time: 1:30 – 1:50 p.m. EST
Description: This webinar highlights the changes and updates in the VTK 6.0 release.
Building Qt-enabled VTK Applications
Date: April 24, 2013
Time: 2:00 – 3:00 p.m. EST
Description: In this webinar, participants learned how to create fully featured applications using VTK and Qt. Topics covered include: configuring your Qt enabled application, understanding the essential VTK and Qt classes, linking VTK events and Qt signals/slots to control the VTK scene from Qt widgets and Qt widgets from VTK components.
Infovis with VTK
Date: February 28, 2013
Time: 1:30 – 2:30 p.m. EST
Description: This webinar focuses on the information visualization capabilities of VTK. We go through the data structures for informatics in VTK (vtkTable, vtkTree, vtkGraph) and explain some common data transformations and algorithms in the context of real-world examples. The webinar features some direct code examples and investigation of the new OpenView information visualization application. You can download the example code and data in a zip file here: infovis-in-vtk-webinar.zip.
VTK 5.10 Release
Date: June 1, 2012
Time: 11:40 – 12:00 p.m EST
Description: Dave DeMarle highlights the new features in VTK 5.10 and gives an overview of what’s coming in the 6.10 release.
Introduction to VTK Course
Date: February 15, 2012
Time: 10:00 – 12:00 p.m. EST
Description: This course provides an overview of the Visualization Toolkit suitable for new users. It covers the various data types supported by VTK, the pipeline architecture used for processing data, and the rendering framework used to display results. Attendees gain hands on experience through several programming examples presented to highlight key concepts. Examples cover the execution pipeline, adjusting parameters, interaction styles, picking, callbacks and 3D widgets. Prerequisites: None, although basic knowledge of C++ is necessary to fully benefit from the programming examples.
Applications Primarily Managed by Kitware
The Insight Segmentation and Registration Toolkit
The Insight Segmentation and Registration Toolkit (ITK) is an open source platform that contains algorithms for medical research. It uses VTK to display results. This example was created using the ViewImage class from the ITKVtkGlue module.

ParaView
ParaView is an open source platform that works with data on the desktop, on the web, on supercomputers, in immersive environments and more. Through VTK, it visualizes datasets related to structural analysis, fluid dynamics, astrophysics, climate science, and LiDAR.

3D Slicer
3D Slicer is an open source extensible platform for visualization and medical image analysis. It has applications in preclinical animal studies, surgical planning and guidance, medical robot control and population studies. The platform uses VTK for its 2D and 3D rendering pipelines, linear and non-linear transformation, segmentation infrastructure, mesh processing, and virtual reality integration. 3D Slicer is funded and directed by the National Alliance for Medical Image Computing, the Neuroimage Analysis Center, the National Center for Image-Guided Therapy, and additional National Institutes of Health and government initiatives.

Other Applications
Andretta Innovations LLC
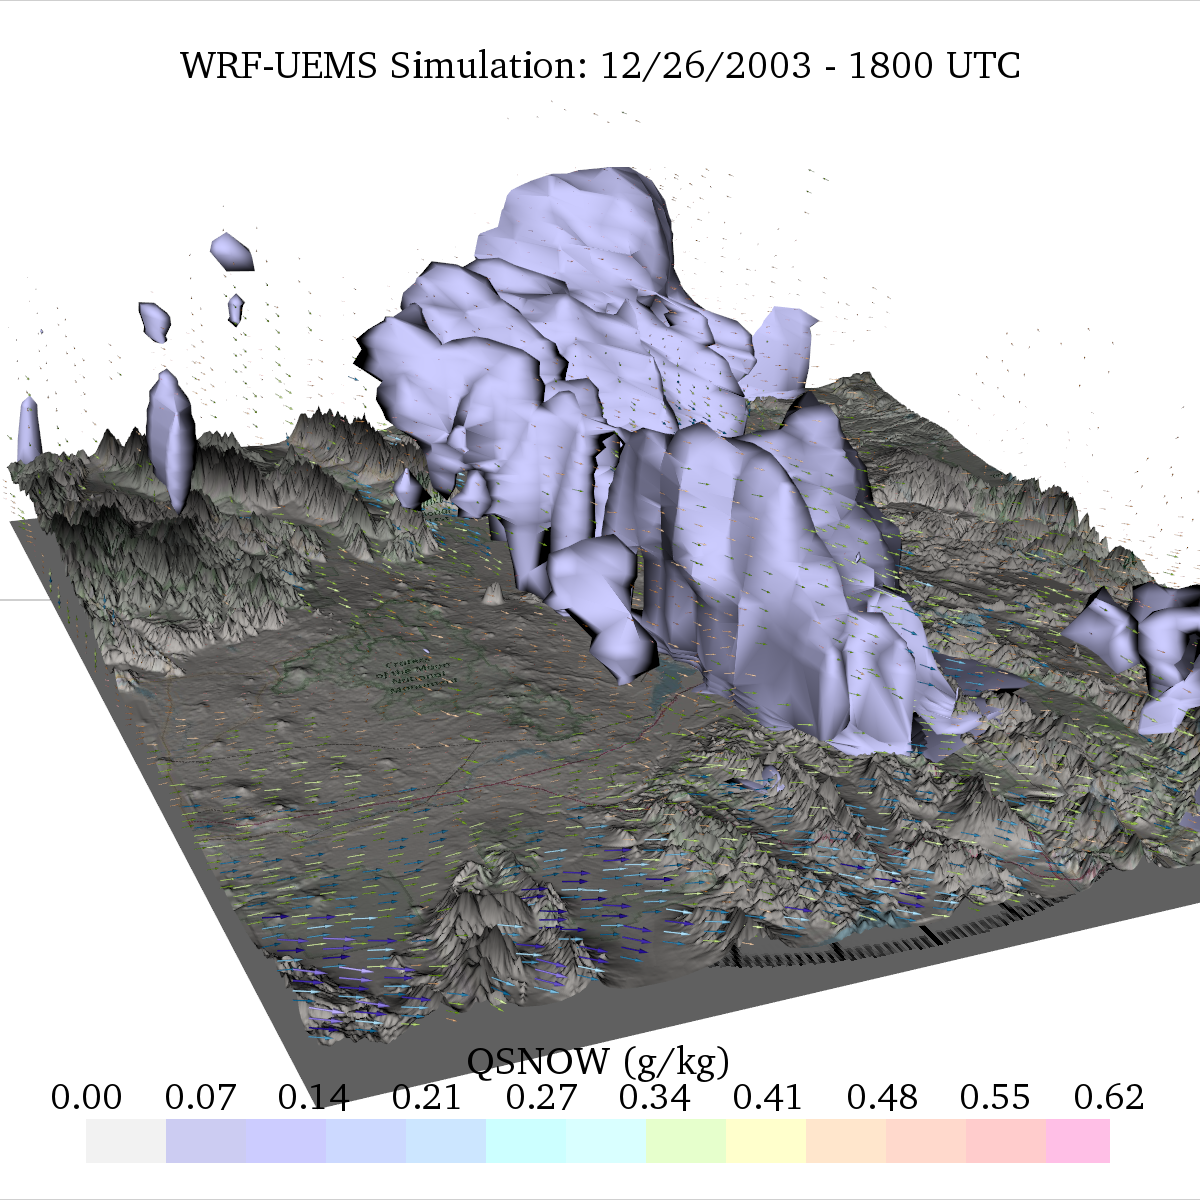
Andretta Innovations LLC developed a Weather Research and Forecasting (WRF) Model 4D visualizer in Python/VTK. The program, designed by Dr. Thomas Andretta, post-processes WRF netCDF output files into a multi-dimensional visual presentation for meteorologists and research scientists. It has options for displaying terrain, microphysics species, and wind vectors as functions of the model time step, grid spacing, and elevation.
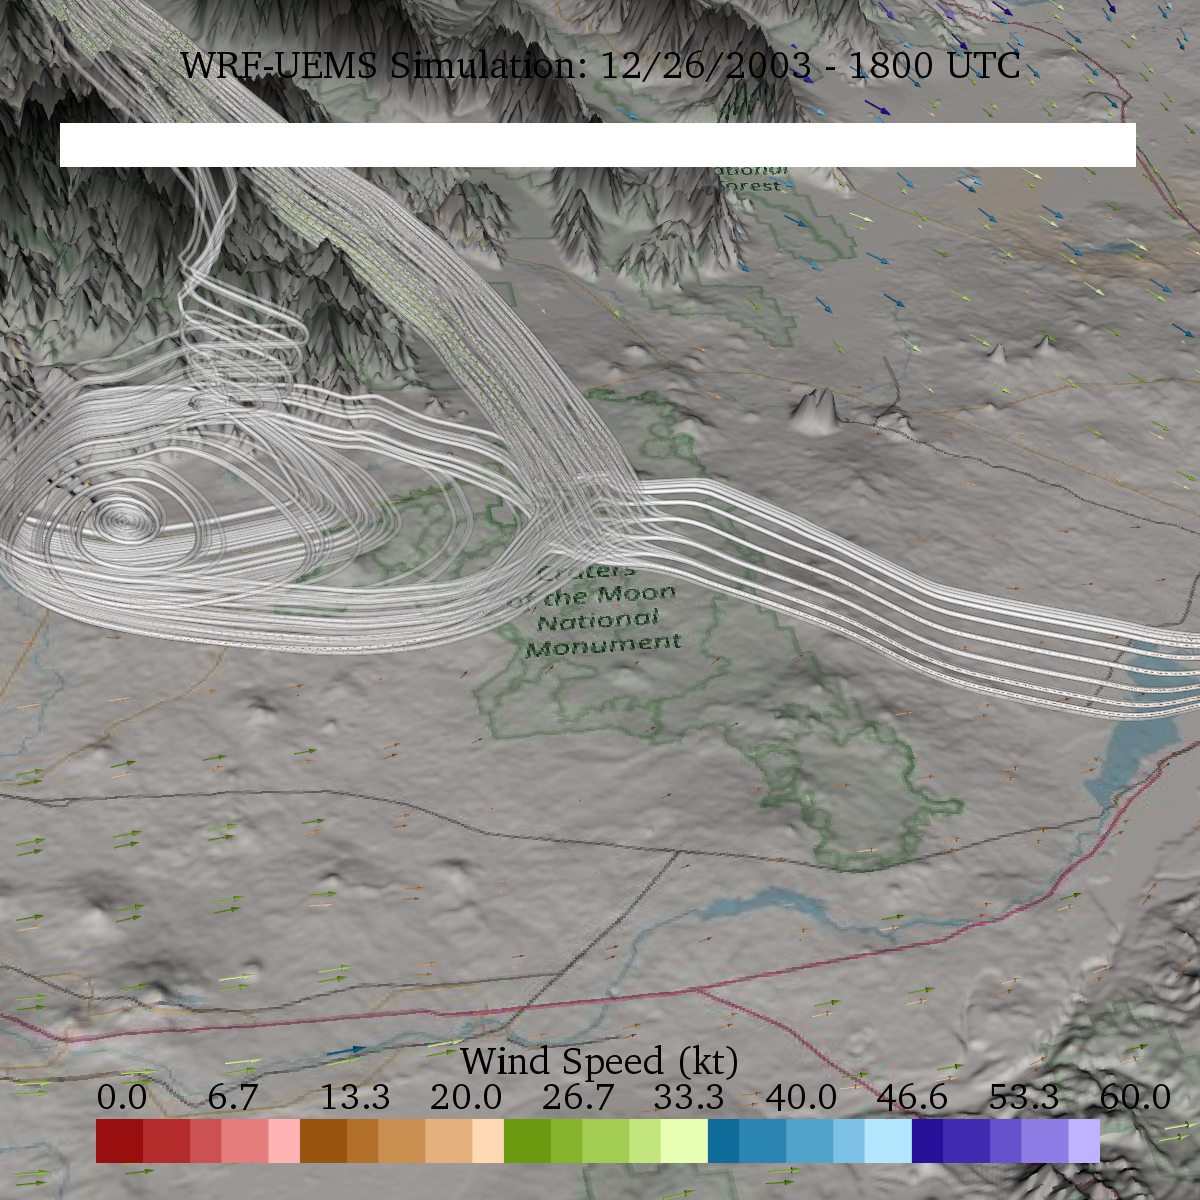
The example shows a snowstorm from December 26, 2003, 1800 UTC, in eastern Idaho. Multiple snowbands (purple) are visible over a wide valley and adjacent mountains. Low-level winds are strongest (green to blue) over higher terrain.
Streamtracer tubes (white) highlight a small circulation center in the valley.
MagNet
MagNet for SOLIDWORKS is the foremost 3D electromagnetic field simulator embedded in the industry-leading computer-aided design software. It offers just one design environment for drawing the model and analyzing the performance of any electromagnetic device. Examples include power transformers, sensors, MRI devices, actuators and solenoids. MagNet utilizes VTK’s glyphing, slicing, and clipping annotation capabilities to display visual elements.
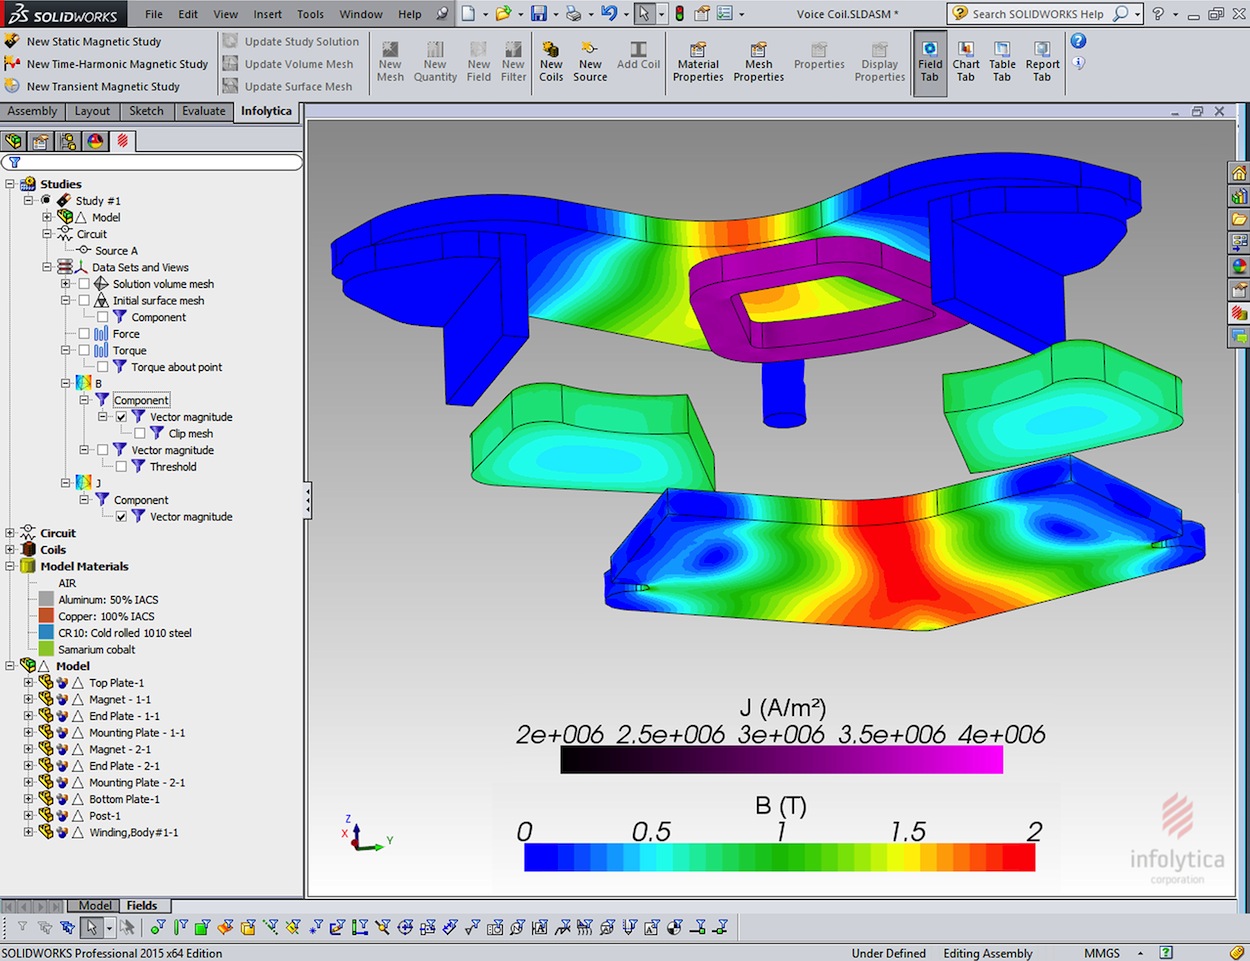
Current and flux density in a voice coil assembly.
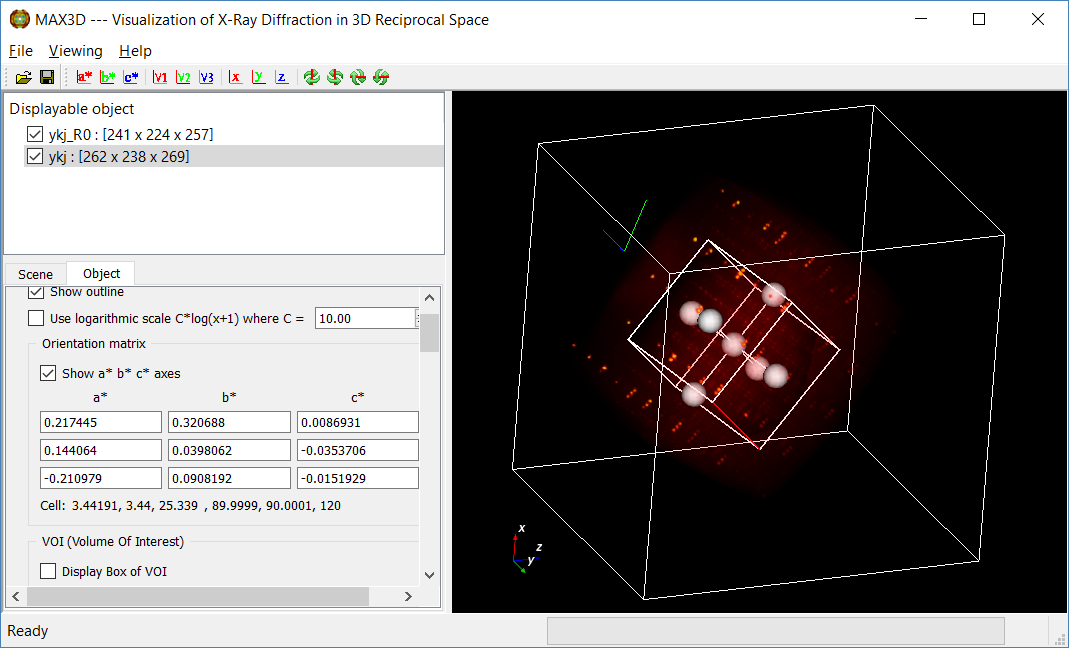
MAX3D
MAX3D is a software package that analyzes and visualizes X-ray diffraction in 3D reciprocal space. It uses VTK as its rendering engine and Qt as its GUI builder. MAX3D has been installed and used in over 100 labs around the world. It supports multiple vendor-specific image formats such as Bruker, Mar, Rigaku (d*TREK and R-AXIS), and STOE.

Osirix
OsiriX is image-processing software dedicated to DICOM images produced by MRI, CT, PET, PET-CT, SPECT-CT, and ultrasound equipment. It is fully compliant with the DICOM standard for image communication and image file formats. Specifically, OsiriX can receive images transferred by DICOM communication protocol from any picture archiving and communication system or imaging modality, and it can navigate and visualize multidimensional images with the facilities provided by VTK and ITK.
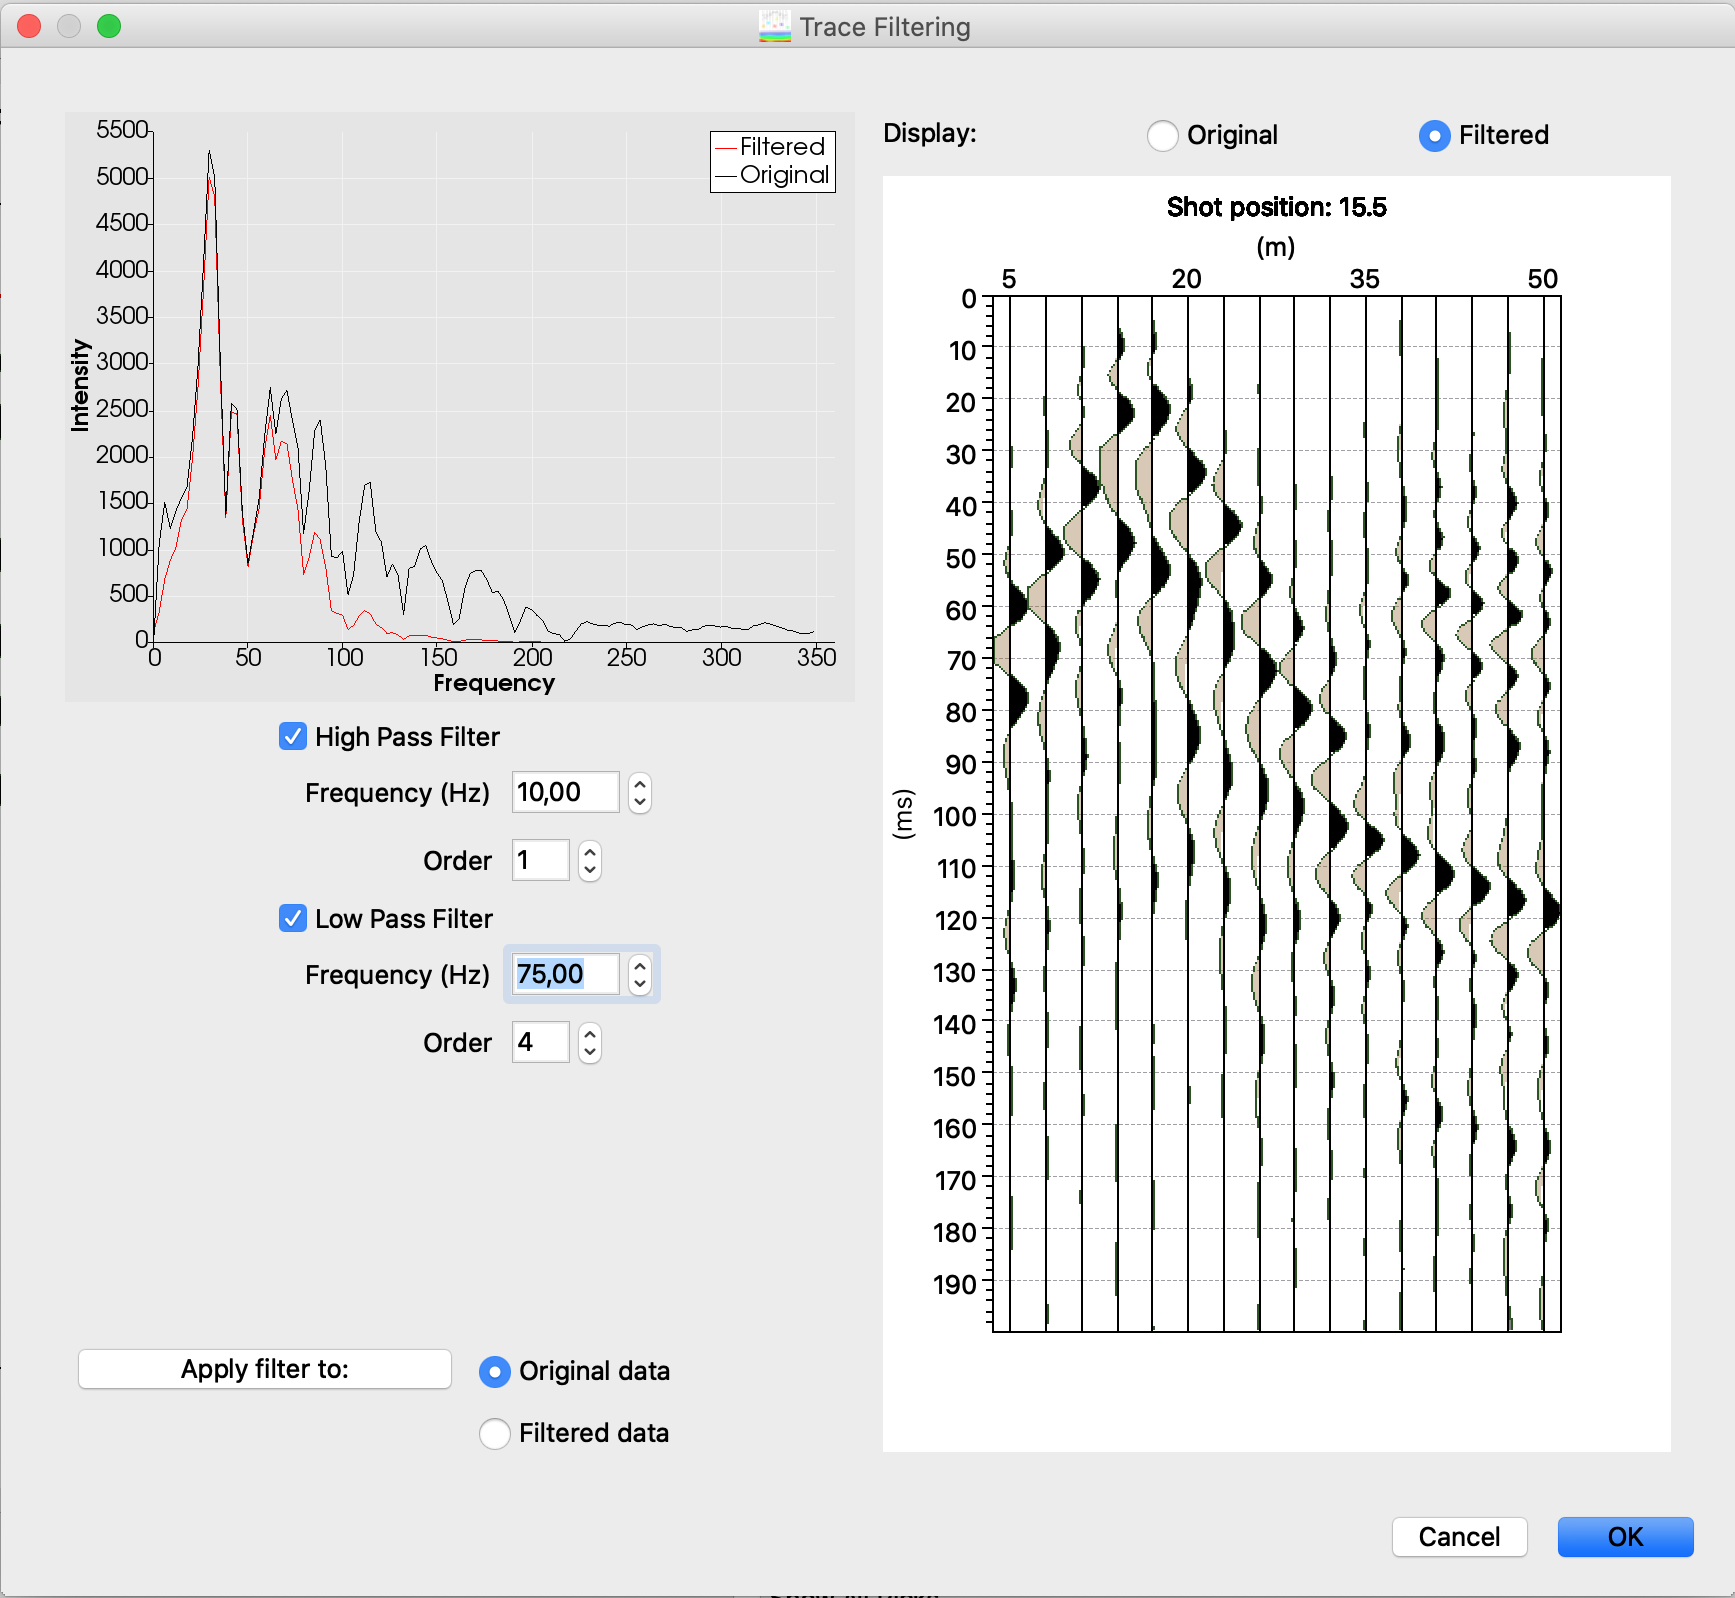
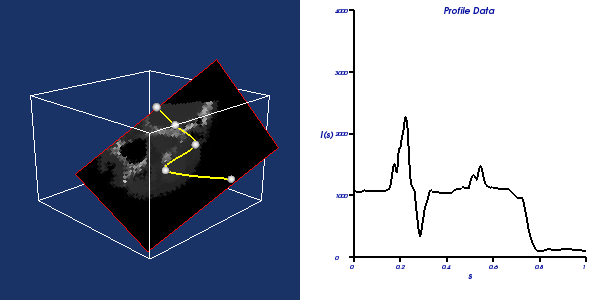
SmartTomo
SmartTomo is a software for processing seismic refraction data. It allows building an image of the subsoil through a fast and intuitive procedure. The result is obtained through the optimization of an initial model that is defined by the user to reproduce the geological features of the survey area. To be efficient, smartTomo uses the computing power of modern multicore CPUs and minimizes the memory consumption. SmartTomo exploits the capabilities of VTK to both build and render the tomographic profile: the image of the subsoil is built as a structured grid with an associated scalar field, while a specialized VTK OpenGL widget is used as a visualization window.